
|
DCF -Bewertung der American Tower Corporation (AMT) |
Fully Editable: Tailor To Your Needs In Excel Or Sheets
Professional Design: Trusted, Industry-Standard Templates
Investor-Approved Valuation Models
MAC/PC Compatible, Fully Unlocked
No Expertise Is Needed; Easy To Follow
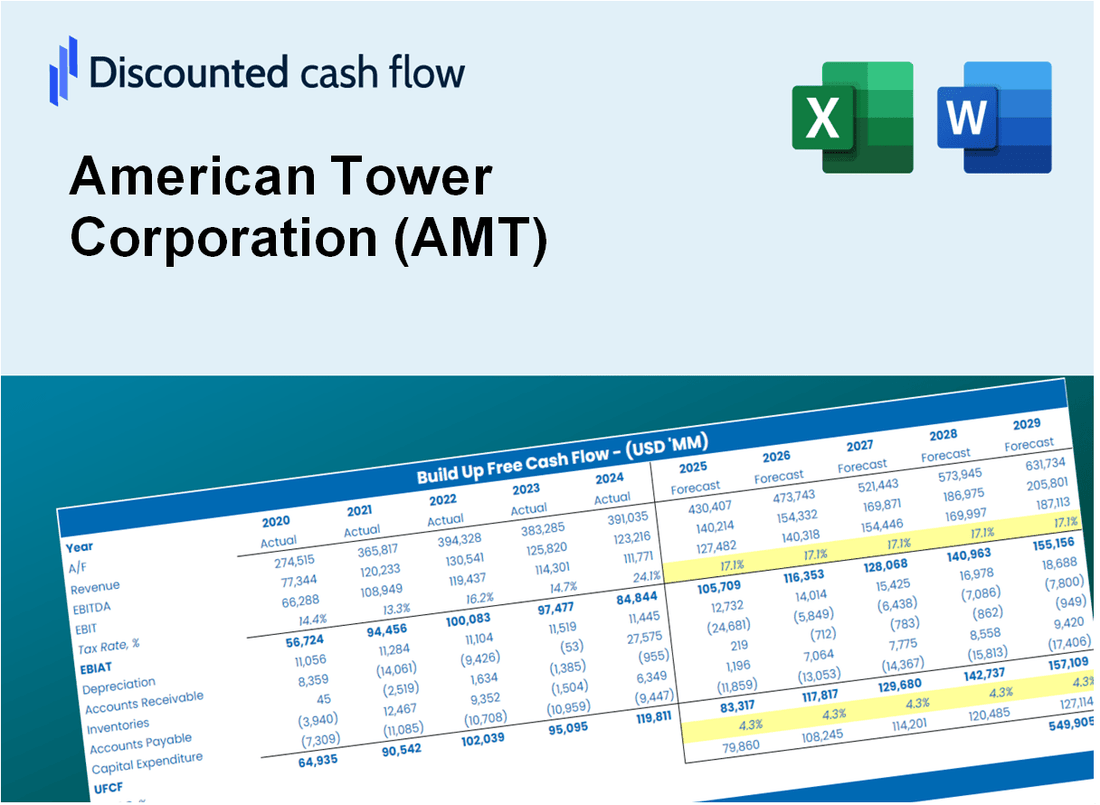
American Tower Corporation (AMT) Bundle
Verbessern Sie Ihre Anlagestrategien mit dem (AMT) DCF -Taschenrechner! Erforschen Sie die tatsächlichen Finanzdaten für die American Tower Corporation, passen Sie die Wachstumsvorhersagen und -kosten an und beobachten Sie sofort, wie sich diese Modifikationen auf den inneren Wert von (AMT) auswirken.
Discounted Cash Flow (DCF) - (USD MM)
| Year | AY1 2020 |
AY2 2021 |
AY3 2022 |
AY4 2023 |
AY5 2024 |
FY1 2025 |
FY2 2026 |
FY3 2027 |
FY4 2028 |
FY5 2029 |
|---|---|---|---|---|---|---|---|---|---|---|
| Revenue | 8,041.5 | 9,356.9 | 9,645.4 | 10,012.2 | 10,127.2 | 10,744.8 | 11,400.0 | 12,095.2 | 12,832.7 | 13,615.3 |
| Revenue Growth, % | 0 | 16.36 | 3.08 | 3.8 | 1.15 | 6.1 | 6.1 | 6.1 | 6.1 | 6.1 |
| EBITDA | 4,496.9 | 6,032.9 | 6,577.1 | 6,004.0 | 7,154.1 | 6,859.3 | 7,277.6 | 7,721.4 | 8,192.3 | 8,691.9 |
| EBITDA, % | 55.92 | 64.48 | 68.19 | 59.97 | 70.64 | 63.84 | 63.84 | 63.84 | 63.84 | 63.84 |
| Depreciation | 1,882.3 | 2,332.6 | 3,355.1 | 3,086.5 | 2,124.8 | 2,899.6 | 3,076.4 | 3,264.0 | 3,463.0 | 3,674.2 |
| Depreciation, % | 23.41 | 24.93 | 34.78 | 30.83 | 20.98 | 26.99 | 26.99 | 26.99 | 26.99 | 26.99 |
| EBIT | 2,614.6 | 3,700.3 | 3,222.0 | 2,917.5 | 5,029.3 | 3,959.8 | 4,201.2 | 4,457.4 | 4,729.3 | 5,017.7 |
| EBIT, % | 32.51 | 39.55 | 33.4 | 29.14 | 49.66 | 36.85 | 36.85 | 36.85 | 36.85 | 36.85 |
| Total Cash | 1,746.3 | 1,949.9 | 2,028.4 | 1,753.7 | 1,999.6 | 2,167.1 | 2,299.3 | 2,439.5 | 2,588.2 | 2,746.1 |
| Total Cash, percent | .0 | .0 | .0 | .0 | .0 | .0 | .0 | .0 | .0 | .0 |
| Account Receivables | 754.8 | 1,082.4 | 1,125.7 | 813.2 | 784.8 | 1,042.2 | 1,105.7 | 1,173.1 | 1,244.7 | 1,320.6 |
| Account Receivables, % | 9.39 | 11.57 | 11.67 | 8.12 | 7.75 | 9.7 | 9.7 | 9.7 | 9.7 | 9.7 |
| Inventories | .0 | .0 | .0 | .0 | .0 | .0 | .0 | .0 | .0 | .0 |
| Inventories, % | 0 | 0 | 0 | 0 | 0 | 0 | 0 | 0 | 0 | 0 |
| Accounts Payable | 139.1 | 272.4 | 218.6 | 251.3 | 240.8 | 253.5 | 268.9 | 285.3 | 302.7 | 321.2 |
| Accounts Payable, % | 1.73 | 2.91 | 2.27 | 2.51 | 2.38 | 2.36 | 2.36 | 2.36 | 2.36 | 2.36 |
| Capital Expenditure | -1,031.7 | -1,376.7 | -1,873.6 | -1,798.1 | -1,590.0 | -1,732.6 | -1,838.3 | -1,950.4 | -2,069.3 | -2,195.5 |
| Capital Expenditure, % | -12.83 | -14.71 | -19.42 | -17.96 | -15.7 | -16.13 | -16.13 | -16.13 | -16.13 | -16.13 |
| Tax Rate, % | 37.79 | 37.79 | 37.79 | 37.79 | 37.79 | 37.79 | 37.79 | 37.79 | 37.79 | 37.79 |
| EBITAT | 2,427.2 | 3,358.0 | 2,727.4 | 2,829.7 | 3,128.7 | 3,385.1 | 3,591.5 | 3,810.6 | 4,042.9 | 4,289.5 |
| Depreciation | ||||||||||
| Changes in Account Receivables | ||||||||||
| Changes in Inventories | ||||||||||
| Changes in Accounts Payable | ||||||||||
| Capital Expenditure | ||||||||||
| UFCF | 2,662.1 | 4,119.6 | 4,111.8 | 4,463.3 | 3,681.4 | 4,307.3 | 4,781.5 | 5,073.1 | 5,382.5 | 5,710.7 |
| WACC, % | 6.51 | 6.49 | 6.41 | 6.57 | 6.13 | 6.42 | 6.42 | 6.42 | 6.42 | 6.42 |
| PV UFCF | ||||||||||
| SUM PV UFCF | 20,859.1 | |||||||||
| Long Term Growth Rate, % | 4.00 | |||||||||
| Free cash flow (T + 1) | 5,939 | |||||||||
| Terminal Value | 245,420 | |||||||||
| Present Terminal Value | 179,801 | |||||||||
| Enterprise Value | 200,660 | |||||||||
| Net Debt | 41,955 | |||||||||
| Equity Value | 158,706 | |||||||||
| Diluted Shares Outstanding, MM | 468 | |||||||||
| Equity Value Per Share | 339.03 |
What You Will Receive
- Customizable Excel Template: A fully adaptable Excel-based DCF Calculator featuring pre-filled real AMT financials.
- Actual Data: Historical performance data and forward-looking projections (highlighted in the yellow cells).
- Adjustable Forecasts: Modify key assumptions such as revenue growth, EBITDA %, and WACC.
- Instant Calculations: Quickly observe how your inputs influence American Tower Corporation’s valuation.
- Professional Resource: Designed for investors, CFOs, consultants, and financial analysts.
- Intuitive Layout: Organized for clarity and ease of navigation, complete with step-by-step guidance.
Key Features
- 🔍 Real-Life AMT Financials: Pre-filled historical and projected data for American Tower Corporation (AMT).
- ✏️ Fully Customizable Inputs: Adjust all critical parameters (yellow cells) like WACC, growth %, and tax rates.
- 📊 Professional DCF Valuation: Built-in formulas calculate American Tower’s intrinsic value using the Discounted Cash Flow method.
- ⚡ Instant Results: Visualize American Tower’s valuation instantly after making changes.
- Scenario Analysis: Test and compare outcomes for various financial assumptions side-by-side.
How It Works
- Step 1: Download the prebuilt Excel template featuring American Tower Corporation’s (AMT) data.
- Step 2: Navigate through the pre-filled sheets to familiarize yourself with the essential metrics.
- Step 3: Modify forecasts and assumptions in the editable yellow cells (WACC, growth, margins).
- Step 4: Instantly observe the recalculated results, including American Tower Corporation’s (AMT) intrinsic value.
- Step 5: Utilize the outputs to make informed investment decisions or generate comprehensive reports.
Why Choose This Calculator for American Tower Corporation (AMT)?
- Accurate Data: Utilize real American Tower financials for dependable valuation outcomes.
- Customizable: Modify essential parameters such as growth rates, WACC, and tax rates to align with your forecasts.
- Time-Saving: Pre-configured calculations save you the hassle of starting from square one.
- Professional-Grade Tool: Tailored for investors, analysts, and consultants in the telecommunications sector.
- User-Friendly: An intuitive design and clear, step-by-step guidance make it accessible for all users.
Who Should Use This Product?
- Individual Investors: Make informed decisions about buying or selling American Tower Corporation (AMT) stock.
- Financial Analysts: Streamline valuation processes with ready-to-use financial models for American Tower Corporation (AMT).
- Consultants: Deliver professional valuation insights on American Tower Corporation (AMT) to clients quickly and accurately.
- Business Owners: Understand how large companies like American Tower Corporation (AMT) are valued to guide your own strategy.
- Finance Students: Learn valuation techniques using real-world data and scenarios related to American Tower Corporation (AMT).
What the Template Contains
- Preloaded AMT Data: Historical and projected financial data, including revenue, EBIT, and capital expenditures.
- DCF and WACC Models: Professional-grade sheets for calculating intrinsic value and Weighted Average Cost of Capital.
- Editable Inputs: Yellow-highlighted cells for adjusting revenue growth, tax rates, and discount rates.
- Financial Statements: Comprehensive annual and quarterly financials for deeper analysis.
- Key Ratios: Profitability, leverage, and efficiency ratios to evaluate performance.
- Dashboard and Charts: Visual summaries of valuation outcomes and assumptions.
Disclaimer
All information, articles, and product details provided on this website are for general informational and educational purposes only. We do not claim any ownership over, nor do we intend to infringe upon, any trademarks, copyrights, logos, brand names, or other intellectual property mentioned or depicted on this site. Such intellectual property remains the property of its respective owners, and any references here are made solely for identification or informational purposes, without implying any affiliation, endorsement, or partnership.
We make no representations or warranties, express or implied, regarding the accuracy, completeness, or suitability of any content or products presented. Nothing on this website should be construed as legal, tax, investment, financial, medical, or other professional advice. In addition, no part of this site—including articles or product references—constitutes a solicitation, recommendation, endorsement, advertisement, or offer to buy or sell any securities, franchises, or other financial instruments, particularly in jurisdictions where such activity would be unlawful.
All content is of a general nature and may not address the specific circumstances of any individual or entity. It is not a substitute for professional advice or services. Any actions you take based on the information provided here are strictly at your own risk. You accept full responsibility for any decisions or outcomes arising from your use of this website and agree to release us from any liability in connection with your use of, or reliance upon, the content or products found herein.