
|
DCF -Bewertung der American Woodmark Corporation (AMWD) |
Fully Editable: Tailor To Your Needs In Excel Or Sheets
Professional Design: Trusted, Industry-Standard Templates
Investor-Approved Valuation Models
MAC/PC Compatible, Fully Unlocked
No Expertise Is Needed; Easy To Follow
American Woodmark Corporation (AMWD) Bundle
Verbessern Sie Ihre Investitionsauswahl mit dem DCF -Taschenrechner der American Woodmark Corporation (AMWD)! Überprüfen Sie authentische Finanzdaten, passen Sie Wachstumsprognosen und -kosten an und beachten Sie sofort, wie sich diese Veränderungen auf den inneren Wert der American Woodmark Corporation (AMWD) auswirken.
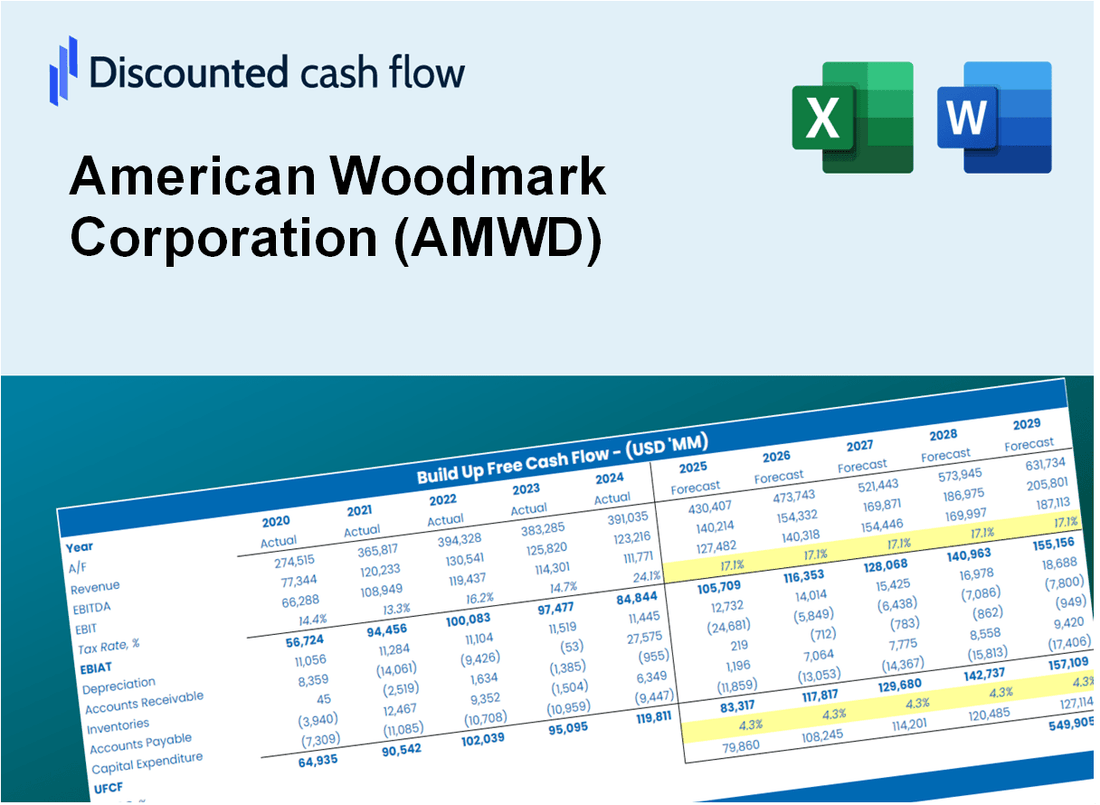
Discounted Cash Flow (DCF) - (USD MM)
| Year | AY1 2021 |
AY2 2022 |
AY3 2023 |
AY4 2024 |
AY5 2025 |
FY1 2026 |
FY2 2027 |
FY3 2028 |
FY4 2029 |
FY5 2030 |
|---|---|---|---|---|---|---|---|---|---|---|
| Revenue | 1,744.0 | 1,857.2 | 2,066.2 | 1,847.5 | 1,709.6 | 1,708.3 | 1,707.0 | 1,705.7 | 1,704.4 | 1,703.1 |
| Revenue Growth, % | 0 | 6.49 | 11.25 | -10.58 | -7.47 | -0.07652438 | -0.07652438 | -0.07652438 | -0.07652438 | -0.07652438 |
| EBITDA | 230.0 | 63.8 | 228.6 | 239.0 | 200.0 | 178.8 | 178.6 | 178.5 | 178.4 | 178.2 |
| EBITDA, % | 13.19 | 3.44 | 11.06 | 12.93 | 11.7 | 10.46 | 10.46 | 10.46 | 10.46 | 10.46 |
| Depreciation | 126.2 | 96.6 | 93.7 | 78.8 | 55.2 | 83.6 | 83.5 | 83.5 | 83.4 | 83.3 |
| Depreciation, % | 7.24 | 5.2 | 4.54 | 4.26 | 3.23 | 4.89 | 4.89 | 4.89 | 4.89 | 4.89 |
| EBIT | 103.8 | -32.8 | 134.9 | 160.2 | 144.8 | 95.2 | 95.1 | 95.0 | 95.0 | 94.9 |
| EBIT, % | 5.95 | -1.77 | 6.53 | 8.67 | 8.47 | 5.57 | 5.57 | 5.57 | 5.57 | 5.57 |
| Total Cash | 91.1 | 22.3 | 41.7 | 87.4 | 48.2 | 54.6 | 54.6 | 54.6 | 54.5 | 54.5 |
| Total Cash, percent | .0 | .0 | .0 | .0 | .0 | .0 | .0 | .0 | .0 | .0 |
| Account Receivables | 146.9 | 157.0 | 119.2 | 132.1 | 113.7 | 124.5 | 124.4 | 124.3 | 124.2 | 124.1 |
| Account Receivables, % | 8.42 | 8.45 | 5.77 | 7.15 | 6.65 | 7.29 | 7.29 | 7.29 | 7.29 | 7.29 |
| Inventories | 158.2 | 228.3 | 190.7 | 159.1 | 178.1 | 169.5 | 169.4 | 169.3 | 169.1 | 169.0 |
| Inventories, % | 9.07 | 12.29 | 9.23 | 8.61 | 10.42 | 9.92 | 9.92 | 9.92 | 9.92 | 9.92 |
| Accounts Payable | 91.6 | 111.4 | 63.9 | 64.5 | 141.7 | 89.3 | 89.2 | 89.1 | 89.0 | 89.0 |
| Accounts Payable, % | 5.25 | 6 | 3.09 | 3.49 | 8.29 | 5.22 | 5.22 | 5.22 | 5.22 | 5.22 |
| Capital Expenditure | -35.7 | -44.1 | -42.6 | -91.0 | -42.8 | -47.5 | -47.5 | -47.5 | -47.4 | -47.4 |
| Capital Expenditure, % | -2.05 | -2.38 | -2.06 | -4.93 | -2.5 | -2.78 | -2.78 | -2.78 | -2.78 | -2.78 |
| Tax Rate, % | 21.4 | 21.4 | 21.4 | 21.4 | 21.4 | 21.4 | 21.4 | 21.4 | 21.4 | 21.4 |
| EBITAT | 78.7 | -22.7 | 103.0 | 122.5 | 113.8 | 71.7 | 71.6 | 71.6 | 71.5 | 71.4 |
| Depreciation | ||||||||||
| Changes in Account Receivables | ||||||||||
| Changes in Inventories | ||||||||||
| Changes in Accounts Payable | ||||||||||
| Capital Expenditure | ||||||||||
| UFCF | -44.2 | -30.6 | 182.0 | 129.4 | 202.8 | 53.1 | 107.8 | 107.7 | 107.6 | 107.5 |
| WACC, % | 7.01 | 6.93 | 7.02 | 7.02 | 7.04 | 7 | 7 | 7 | 7 | 7 |
| PV UFCF | ||||||||||
| SUM PV UFCF | 390.4 | |||||||||
| Long Term Growth Rate, % | 3.50 | |||||||||
| Free cash flow (T + 1) | 111 | |||||||||
| Terminal Value | 3,177 | |||||||||
| Present Terminal Value | 2,265 | |||||||||
| Enterprise Value | 2,655 | |||||||||
| Net Debt | 462 | |||||||||
| Equity Value | 2,194 | |||||||||
| Diluted Shares Outstanding, MM | 15 | |||||||||
| Equity Value Per Share | 143.38 |
What You Will Receive
- Genuine American Woodmark Data: Preloaded financials – encompassing revenue to EBIT – derived from actual and projected figures.
- Complete Customization: Modify all essential parameters (yellow cells) such as WACC, growth %, and tax rates.
- Immediate Valuation Adjustments: Automatic recalculations to assess the effects of changes on American Woodmark’s fair value.
- Flexible Excel Template: Designed for quick modifications, scenario analysis, and comprehensive projections.
- Efficient and Precise: Avoid the hassle of building models from the ground up while ensuring accuracy and adaptability.
Key Features
- Customizable Financial Inputs: Adjust essential metrics such as revenue growth, EBITDA %, and capital expenditures tailored for American Woodmark Corporation (AMWD).
- Instant DCF Valuation: Automatically computes intrinsic value, NPV, and additional financial outputs with ease.
- High-Precision Accuracy: Leverages American Woodmark's actual financial data for dependable valuation results.
- Effortless Scenario Analysis: Easily experiment with various assumptions and analyze different outcomes.
- Efficiency Booster: Avoid the hassle of constructing intricate valuation models from the ground up.
How It Works
- Step 1: Download the Excel file.
- Step 2: Review American Woodmark Corporation’s (AMWD) pre-filled financial data and forecasts.
- Step 3: Modify key inputs such as revenue growth, WACC, and tax rates (highlighted cells).
- Step 4: Observe the DCF model update in real-time as you adjust your assumptions.
- Step 5: Evaluate the outputs and leverage the results for your investment strategies.
Why Choose This Calculator for American Woodmark Corporation (AMWD)?
- Precise Information: Utilize authentic American Woodmark financials for trustworthy valuation outcomes.
- Flexible Options: Modify essential variables such as growth rates, WACC, and tax rates to align with your forecasts.
- Efficiency Boost: Built-in calculations save you the hassle of starting from the ground up.
- Expert-Level Tool: Tailored for investors, analysts, and consultants in the industry.
- Easy to Use: User-friendly design and clear, step-by-step guidance ensure accessibility for everyone.
Who Should Use American Woodmark Corporation (AMWD)?
- Homeowners: Enhance your living spaces with high-quality cabinetry solutions.
- Contractors: Streamline your projects with reliable and stylish products from a trusted brand.
- Interior Designers: Utilize a diverse range of options to create stunning residential and commercial spaces.
- DIY Enthusiasts: Access user-friendly products that make home improvement projects more manageable.
- Retailers: Partner with a reputable manufacturer to offer customers exceptional cabinetry choices.
What the Template Contains
- Pre-Filled DCF Model: American Woodmark Corporation’s (AMWD) financial data preloaded for immediate use.
- WACC Calculator: Detailed calculations for Weighted Average Cost of Capital.
- Financial Ratios: Evaluate American Woodmark Corporation’s (AMWD) profitability, leverage, and efficiency.
- Editable Inputs: Change assumptions such as growth, margins, and CAPEX to fit your scenarios.
- Financial Statements: Annual and quarterly reports to support detailed analysis.
- Interactive Dashboard: Easily visualize key valuation metrics and results.
Disclaimer
All information, articles, and product details provided on this website are for general informational and educational purposes only. We do not claim any ownership over, nor do we intend to infringe upon, any trademarks, copyrights, logos, brand names, or other intellectual property mentioned or depicted on this site. Such intellectual property remains the property of its respective owners, and any references here are made solely for identification or informational purposes, without implying any affiliation, endorsement, or partnership.
We make no representations or warranties, express or implied, regarding the accuracy, completeness, or suitability of any content or products presented. Nothing on this website should be construed as legal, tax, investment, financial, medical, or other professional advice. In addition, no part of this site—including articles or product references—constitutes a solicitation, recommendation, endorsement, advertisement, or offer to buy or sell any securities, franchises, or other financial instruments, particularly in jurisdictions where such activity would be unlawful.
All content is of a general nature and may not address the specific circumstances of any individual or entity. It is not a substitute for professional advice or services. Any actions you take based on the information provided here are strictly at your own risk. You accept full responsibility for any decisions or outcomes arising from your use of this website and agree to release us from any liability in connection with your use of, or reliance upon, the content or products found herein.