
|
Anebulo Pharmaceuticals, Inc. (ANEB) DCF -Bewertung |
Fully Editable: Tailor To Your Needs In Excel Or Sheets
Professional Design: Trusted, Industry-Standard Templates
Investor-Approved Valuation Models
MAC/PC Compatible, Fully Unlocked
No Expertise Is Needed; Easy To Follow
Anebulo Pharmaceuticals, Inc. (ANEB) Bundle
Stürzen Sie Ihre Analyse und verbessern Sie die Präzision mit unserem (ANEB) DCF -Taschenrechner! Mit echten Daten von Anebulo -Pharmazeutika und anpassbaren Annahmen ermöglichen dieses Tool Sie, Anebulo wie ein erfahrener Investor zu prognostizieren, zu analysieren und zu schätzen.
Discounted Cash Flow (DCF) - (USD MM)
| Year | AY1 2021 |
AY2 2022 |
AY3 2023 |
AY4 2024 |
AY5 2025 |
FY1 2026 |
FY2 2027 |
FY3 2028 |
FY4 2029 |
FY5 2030 |
|---|---|---|---|---|---|---|---|---|---|---|
| Revenue | .0 | .0 | .0 | .0 | .0 | .0 | .0 | .0 | .0 | .0 |
| Revenue Growth, % | 0 | 0 | 0 | 0 | 0 | 0 | 0 | 0 | 0 | 0 |
| EBITDA | -30.2 | .0 | -11.8 | -7.8 | -9.2 | .0 | .0 | .0 | .0 | .0 |
| EBITDA, % | 100 | 100 | 100 | 100 | 100 | 100 | 100 | 100 | 100 | 100 |
| Depreciation | .0 | 6.8 | 11.8 | .3 | .0 | .0 | .0 | .0 | .0 | .0 |
| Depreciation, % | 100 | 100 | 100 | 100 | 100 | 100 | 100 | 100 | 100 | 100 |
| EBIT | -30.2 | -6.8 | -23.6 | -8.1 | -9.2 | .0 | .0 | .0 | .0 | .0 |
| EBIT, % | 100 | 100 | 100 | 100 | 100 | 100 | 100 | 100 | 100 | 100 |
| Total Cash | 20.0 | 14.5 | 11.2 | 3.1 | 11.6 | .0 | .0 | .0 | .0 | .0 |
| Total Cash, percent | .0 | .0 | .0 | .0 | .0 | .0 | .0 | .0 | .0 | .0 |
| Account Receivables | .0 | .0 | .0 | .0 | .1 | .0 | .0 | .0 | .0 | .0 |
| Account Receivables, % | 100 | 100 | 100 | 100 | 100 | 100 | 100 | 100 | 100 | 100 |
| Inventories | .0 | .0 | .0 | .0 | .0 | .0 | .0 | .0 | .0 | .0 |
| Inventories, % | 100 | 100 | 100 | 100 | 100 | 100 | 100 | 100 | 100 | 100 |
| Accounts Payable | .1 | .4 | .5 | .2 | .2 | .0 | .0 | .0 | .0 | .0 |
| Accounts Payable, % | 100 | 100 | 100 | 100 | 100 | 100 | 100 | 100 | 100 | 100 |
| Capital Expenditure | .0 | .0 | .0 | .0 | .0 | .0 | .0 | .0 | .0 | .0 |
| Capital Expenditure, % | 100 | 100 | 100 | 100 | 100 | 0 | 0 | 0 | 0 | 0 |
| Tax Rate, % | 0 | 0 | 0 | 0 | 0 | 0 | 0 | 0 | 0 | 0 |
| EBITAT | -30.2 | -6.8 | -23.6 | -8.1 | -9.2 | .0 | .0 | .0 | .0 | .0 |
| Depreciation | ||||||||||
| Changes in Account Receivables | ||||||||||
| Changes in Inventories | ||||||||||
| Changes in Accounts Payable | ||||||||||
| Capital Expenditure | ||||||||||
| UFCF | -30.1 | .3 | -11.6 | -8.2 | -9.2 | -.2 | .0 | .0 | .0 | .0 |
| WACC, % | 4.68 | 4.68 | 4.68 | 4.68 | 4.68 | 4.68 | 4.68 | 4.68 | 4.68 | 4.68 |
| PV UFCF | ||||||||||
| SUM PV UFCF | -.1 | |||||||||
| Long Term Growth Rate, % | 2.00 | |||||||||
| Free cash flow (T + 1) | 0 | |||||||||
| Terminal Value | 0 | |||||||||
| Present Terminal Value | 0 | |||||||||
| Enterprise Value | 0 | |||||||||
| Net Debt | -12 | |||||||||
| Equity Value | 11 | |||||||||
| Diluted Shares Outstanding, MM | 34 | |||||||||
| Equity Value Per Share | 0.34 |
What You Will Get
- Editable Excel Template: A fully customizable Excel-based DCF Calculator with pre-filled real ANEB financials.
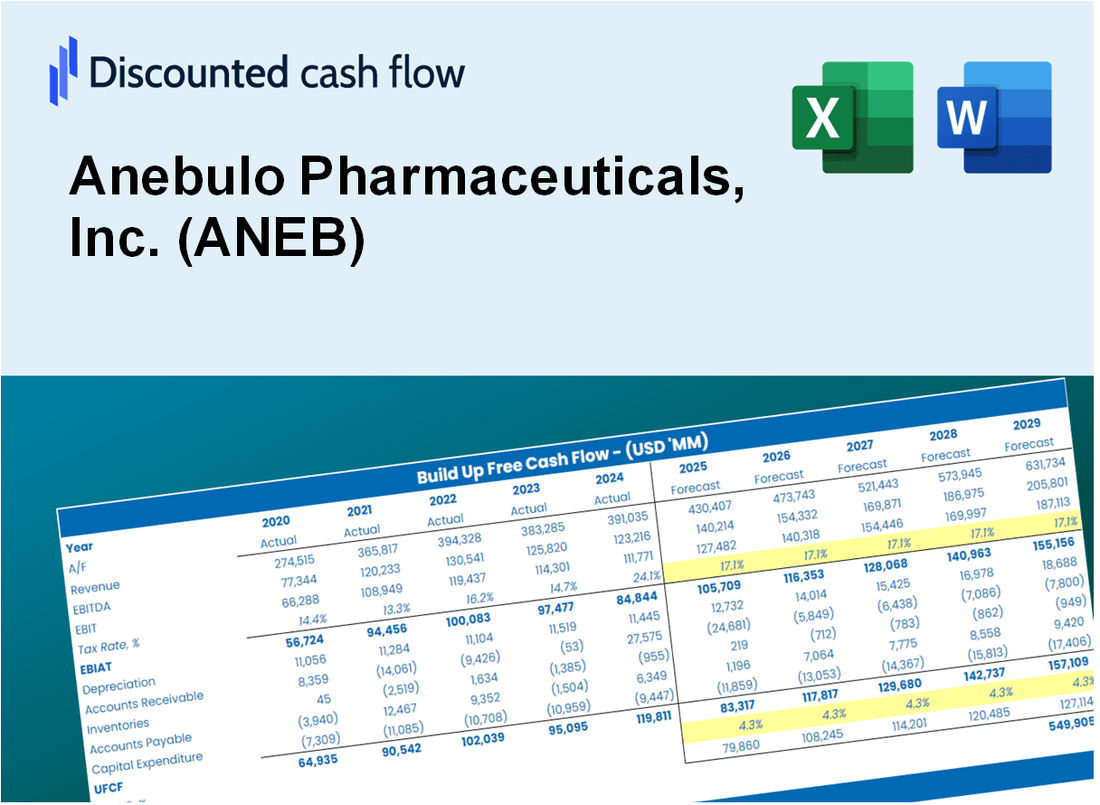
- Real-World Data: Historical data and forward-looking estimates (as shown in the yellow cells).
- Forecast Flexibility: Change forecast assumptions like revenue growth, EBITDA %, and WACC.
- Automatic Calculations: Instantly see the impact of your inputs on Anebulo Pharmaceuticals’ valuation.
- Professional Tool: Built for investors, CFOs, consultants, and financial analysts.
- User-Friendly Design: Structured for clarity and ease of use, with step-by-step instructions.
Key Features
- Comprehensive Drug Development Tracker: Detailed timelines and milestones for Anebulo's pipeline projects.
- Market Opportunity Analysis: Insights into the market landscape and potential revenue streams for ANEB.
- Customizable Financial Projections: Adjust assumptions for R&D expenses, market penetration, and pricing strategies.
- Integrated Risk Assessment Tools: Evaluate clinical trial risks and regulatory hurdles specific to Anebulo Pharmaceuticals.
- User-Friendly Dashboard: Visual representations of key performance indicators and strategic metrics for ANEB.
How It Works
- 1. Access the Model: Download and open the Excel template containing Anebulo Pharmaceuticals, Inc.'s (ANEB) preloaded data.
- 2. Adjust Key Variables: Modify essential inputs such as projected growth rates, discount rates, and research expenditures.
- 3. Analyze Results in Real-Time: The DCF model automatically computes the intrinsic value and net present value (NPV).
- 4. Explore Different Scenarios: Evaluate various forecasts to understand a range of valuation possibilities.
- 5. Present with Assurance: Deliver expert valuation analysis to enhance your strategic decision-making.
Why Choose This Calculator for Anebulo Pharmaceuticals, Inc. (ANEB)?
- Designed for Industry Experts: A specialized tool tailored for researchers, financial analysts, and investors.
- Comprehensive Data: Anebulo’s historical and projected financials integrated for precise analysis.
- Flexible Scenario Analysis: Effortlessly explore various forecasts and assumptions.
- Insightful Outputs: Automatically computes intrinsic value, NPV, and essential financial metrics.
- User-Friendly Interface: Clear, step-by-step guidance to facilitate your calculations.
Who Should Use This Product?
- Investors: Accurately assess Anebulo Pharmaceuticals’ fair value prior to making investment choices.
- CFOs: Utilize a high-quality DCF model for financial reporting and analysis.
- Consultants: Effortlessly customize the template for client valuation reports.
- Entrepreneurs: Acquire insights into financial modeling practices employed by leading pharmaceutical companies.
- Educators: Implement it as a teaching resource to illustrate valuation techniques.
What the Template Contains
- Operating and Balance Sheet Data: Pre-filled Anebulo Pharmaceuticals historical data and forecasts, including revenue, EBITDA, EBIT, and capital expenditures.
- WACC Calculation: A dedicated sheet for Weighted Average Cost of Capital (WACC), including parameters like Beta, risk-free rate, and share price.
- DCF Valuation (Unlevered and Levered): Editable Discounted Cash Flow models showing intrinsic value with detailed calculations.
- Financial Statements: Pre-loaded financial statements (annual and quarterly) to support analysis.
- Key Ratios: Includes profitability, leverage, and efficiency ratios for Anebulo Pharmaceuticals, Inc. (ANEB).
- Dashboard and Charts: Visual summary of valuation outputs and assumptions to analyze results easily.
Disclaimer
All information, articles, and product details provided on this website are for general informational and educational purposes only. We do not claim any ownership over, nor do we intend to infringe upon, any trademarks, copyrights, logos, brand names, or other intellectual property mentioned or depicted on this site. Such intellectual property remains the property of its respective owners, and any references here are made solely for identification or informational purposes, without implying any affiliation, endorsement, or partnership.
We make no representations or warranties, express or implied, regarding the accuracy, completeness, or suitability of any content or products presented. Nothing on this website should be construed as legal, tax, investment, financial, medical, or other professional advice. In addition, no part of this site—including articles or product references—constitutes a solicitation, recommendation, endorsement, advertisement, or offer to buy or sell any securities, franchises, or other financial instruments, particularly in jurisdictions where such activity would be unlawful.
All content is of a general nature and may not address the specific circumstances of any individual or entity. It is not a substitute for professional advice or services. Any actions you take based on the information provided here are strictly at your own risk. You accept full responsibility for any decisions or outcomes arising from your use of this website and agree to release us from any liability in connection with your use of, or reliance upon, the content or products found herein.