
|
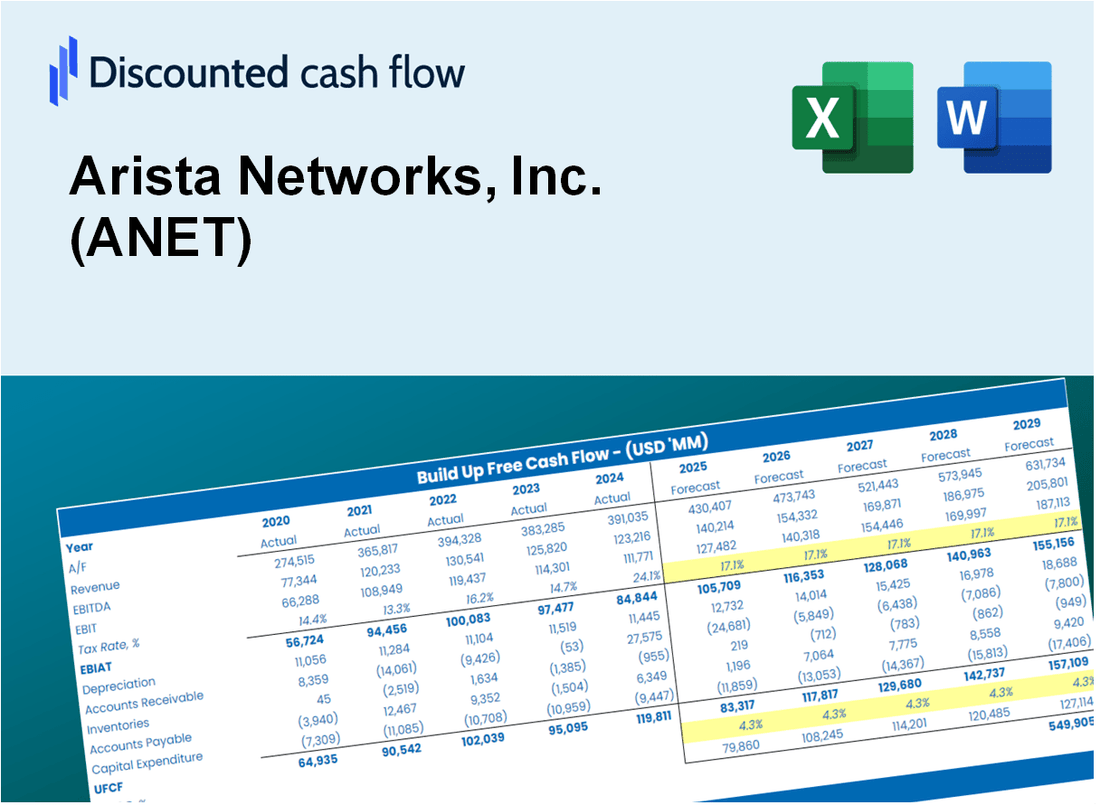
DCF -Bewertung von Arista Networks, Inc. (ANET) |
Fully Editable: Tailor To Your Needs In Excel Or Sheets
Professional Design: Trusted, Industry-Standard Templates
Investor-Approved Valuation Models
MAC/PC Compatible, Fully Unlocked
No Expertise Is Needed; Easy To Follow
Arista Networks, Inc. (ANET) Bundle
Verbessern Sie Ihre Investitionsauswahl mit dem DCF -Taschenrechner von Arista Networks, Inc. (ANET)! Überprüfen Sie authentische Finanzdaten für Arista, passen Sie die Wachstumsvorhersagen und -kosten an und beachten Sie sofort, wie sich diese Veränderungen auf den inneren Wert von Arista Networks, Inc. (ANET) auswirken.
What You Will Get
- Editable Forecast Inputs: Easily modify assumptions (growth %, margins, WACC) to explore various scenarios.
- Real-World Data: Arista Networks, Inc.'s (ANET) financial data pre-filled to kickstart your analysis.
- Automatic DCF Outputs: The template computes Net Present Value (NPV) and intrinsic value automatically.
- Customizable and Professional: A sleek Excel model that adapts to your valuation requirements.
- Built for Analysts and Investors: Perfect for testing projections, validating strategies, and enhancing efficiency.
Key Features
- Comprehensive Historical Data: Arista Networks’ financial statements and detailed forecasts included.
- Customizable Parameters: Modify WACC, tax rates, revenue growth, and EBITDA margins to fit your analysis.
- Real-Time Valuation: Instantly view Arista Networks’ intrinsic value as it updates live.
- Intuitive Visualizations: Engaging dashboard charts illustrate valuation outcomes and essential metrics.
- Designed for Precision: A robust tool tailored for analysts, investors, and financial professionals.
How It Works
- Step 1: Download the Excel file.
- Step 2: Review pre-entered Arista Networks data (historical and projected).
- Step 3: Adjust key assumptions (yellow cells) based on your analysis.
- Step 4: View automatic recalculations for Arista Networks’ intrinsic value.
- Step 5: Use the outputs for investment decisions or reporting.
Why Choose This Calculator for Arista Networks, Inc. (ANET)?
- Accuracy: Utilizes real Arista financial data to ensure precision.
- Flexibility: Tailored for users to easily test and adjust inputs as needed.
- Time-Saving: Avoid the complexities of creating a DCF model from the ground up.
- Professional-Grade: Crafted with the expertise and usability expected at the CFO level.
- User-Friendly: Intuitive interface designed for all users, regardless of financial modeling expertise.
Who Should Use This Product?
- Individual Investors: Make informed decisions about buying or selling Arista Networks, Inc. (ANET) stock.
- Financial Analysts: Streamline valuation processes with ready-to-use financial models for Arista Networks, Inc. (ANET).
- Consultants: Deliver professional valuation insights on Arista Networks, Inc. (ANET) to clients quickly and accurately.
- Business Owners: Understand how leading tech companies like Arista Networks, Inc. (ANET) are valued to guide your own strategy.
- Finance Students: Learn valuation techniques using real-world data and scenarios related to Arista Networks, Inc. (ANET).
What the Template Contains
- Historical Data: Includes Arista Networks, Inc. (ANET)’s past financials and baseline forecasts.
- DCF and Levered DCF Models: Detailed templates to calculate Arista Networks, Inc. (ANET)’s intrinsic value.
- WACC Sheet: Pre-built calculations for Weighted Average Cost of Capital.
- Editable Inputs: Modify key drivers like growth rates, EBITDA %, and CAPEX assumptions.
- Quarterly and Annual Statements: A complete breakdown of Arista Networks, Inc. (ANET)’s financials.
- Interactive Dashboard: Visualize valuation results and projections dynamically.
Disclaimer
All information, articles, and product details provided on this website are for general informational and educational purposes only. We do not claim any ownership over, nor do we intend to infringe upon, any trademarks, copyrights, logos, brand names, or other intellectual property mentioned or depicted on this site. Such intellectual property remains the property of its respective owners, and any references here are made solely for identification or informational purposes, without implying any affiliation, endorsement, or partnership.
We make no representations or warranties, express or implied, regarding the accuracy, completeness, or suitability of any content or products presented. Nothing on this website should be construed as legal, tax, investment, financial, medical, or other professional advice. In addition, no part of this site—including articles or product references—constitutes a solicitation, recommendation, endorsement, advertisement, or offer to buy or sell any securities, franchises, or other financial instruments, particularly in jurisdictions where such activity would be unlawful.
All content is of a general nature and may not address the specific circumstances of any individual or entity. It is not a substitute for professional advice or services. Any actions you take based on the information provided here are strictly at your own risk. You accept full responsibility for any decisions or outcomes arising from your use of this website and agree to release us from any liability in connection with your use of, or reliance upon, the content or products found herein.