
|
Ansys, Inc. (ANSS) DCF -Bewertung |
Fully Editable: Tailor To Your Needs In Excel Or Sheets
Professional Design: Trusted, Industry-Standard Templates
Investor-Approved Valuation Models
MAC/PC Compatible, Fully Unlocked
No Expertise Is Needed; Easy To Follow
ANSYS, Inc. (ANSS) Bundle
Entdecken Sie den wahren Wert von Ansys, Inc. (ANSS) mit unserem fortschrittlichen DCF -Taschenrechner! Passen Sie die wichtigsten Annahmen an, erkunden Sie verschiedene Szenarien und bewerten Sie, wie sich Änderungen auf die Bewertung von ANSYS, Inc. (ANSS) auswirken - alles innerhalb einer einzelnen Excel -Vorlage.
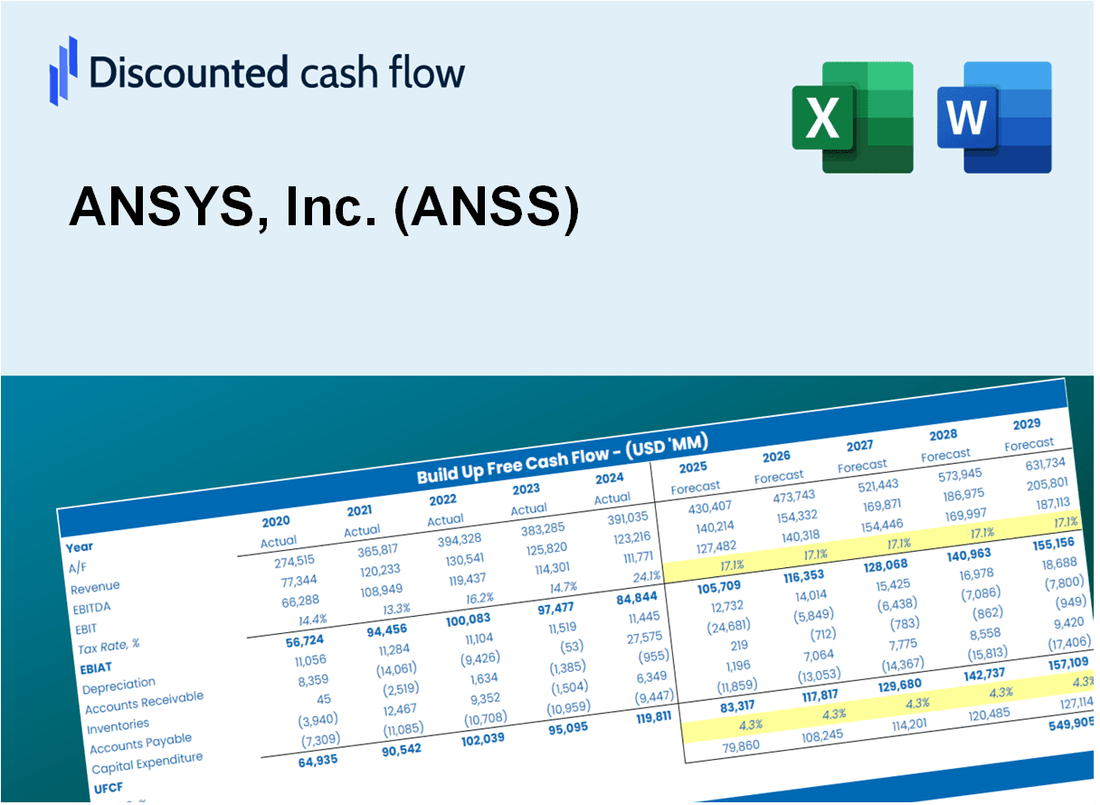
Discounted Cash Flow (DCF) - (USD MM)
| Year | AY1 2020 |
AY2 2021 |
AY3 2022 |
AY4 2023 |
AY5 2024 |
FY1 2025 |
FY2 2026 |
FY3 2027 |
FY4 2028 |
FY5 2029 |
|---|---|---|---|---|---|---|---|---|---|---|
| Revenue | 1,681.3 | 1,906.7 | 2,065.6 | 2,269.9 | 2,544.8 | 2,823.1 | 3,131.8 | 3,474.3 | 3,854.2 | 4,275.7 |
| Revenue Growth, % | 0 | 13.41 | 8.33 | 9.9 | 12.11 | 10.94 | 10.94 | 10.94 | 10.94 | 10.94 |
| EBITDA | 581.6 | 620.1 | 707.2 | 758.6 | 908.6 | 962.6 | 1,067.8 | 1,184.6 | 1,314.1 | 1,457.8 |
| EBITDA, % | 34.59 | 32.52 | 34.24 | 33.42 | 35.7 | 34.1 | 34.1 | 34.1 | 34.1 | 34.1 |
| Depreciation | 106.2 | 129.1 | 137.3 | 132.5 | 142.7 | 176.0 | 195.3 | 216.6 | 240.3 | 266.6 |
| Depreciation, % | 6.32 | 6.77 | 6.65 | 5.84 | 5.61 | 6.24 | 6.24 | 6.24 | 6.24 | 6.24 |
| EBIT | 475.4 | 491.1 | 569.9 | 626.1 | 765.9 | 786.5 | 872.5 | 968.0 | 1,073.8 | 1,191.2 |
| EBIT, % | 28.27 | 25.76 | 27.59 | 27.58 | 30.1 | 27.86 | 27.86 | 27.86 | 27.86 | 27.86 |
| Total Cash | 913.2 | 668.0 | 614.6 | 860.4 | 1,497.5 | 1,218.7 | 1,352.0 | 1,499.9 | 1,663.9 | 1,845.8 |
| Total Cash, percent | .0 | .0 | .0 | .0 | .0 | .0 | .0 | .0 | .0 | .0 |
| Account Receivables | 761.3 | 918.1 | 998.4 | 1,140.3 | 1,275.2 | 1,367.0 | 1,516.5 | 1,682.3 | 1,866.3 | 2,070.4 |
| Account Receivables, % | 45.28 | 48.15 | 48.34 | 50.23 | 50.11 | 48.42 | 48.42 | 48.42 | 48.42 | 48.42 |
| Inventories | -44.7 | -52.4 | -51.2 | .0 | .0 | -44.5 | -49.4 | -54.8 | -60.8 | -67.5 |
| Inventories, % | -2.66 | -2.75 | -2.48 | 0 | 0 | -1.58 | -1.58 | -1.58 | -1.58 | -1.58 |
| Accounts Payable | 18.7 | 10.9 | 14.0 | 22.8 | 27.1 | 25.0 | 27.7 | 30.8 | 34.1 | 37.9 |
| Accounts Payable, % | 1.11 | 0.56972 | 0.6788 | 1 | 1.06 | 0.88537 | 0.88537 | 0.88537 | 0.88537 | 0.88537 |
| Capital Expenditure | -35.4 | -23.0 | -24.4 | -25.3 | -44.0 | -41.4 | -46.0 | -51.0 | -56.6 | -62.7 |
| Capital Expenditure, % | -2.1 | -1.21 | -1.18 | -1.12 | -1.73 | -1.47 | -1.47 | -1.47 | -1.47 | -1.47 |
| Tax Rate, % | 19.82 | 19.82 | 19.82 | 19.82 | 19.82 | 19.82 | 19.82 | 19.82 | 19.82 | 19.82 |
| EBITAT | 417.6 | 433.2 | 518.8 | 529.1 | 614.1 | 679.2 | 753.5 | 835.9 | 927.3 | 1,028.7 |
| Depreciation | ||||||||||
| Changes in Account Receivables | ||||||||||
| Changes in Inventories | ||||||||||
| Changes in Accounts Payable | ||||||||||
| Capital Expenditure | ||||||||||
| UFCF | -209.4 | 382.4 | 553.3 | 452.0 | 582.0 | 764.5 | 760.9 | 844.1 | 936.4 | 1,038.9 |
| WACC, % | 9.49 | 9.49 | 9.49 | 9.48 | 9.48 | 9.49 | 9.49 | 9.49 | 9.49 | 9.49 |
| PV UFCF | ||||||||||
| SUM PV UFCF | 3,288.3 | |||||||||
| Long Term Growth Rate, % | 4.00 | |||||||||
| Free cash flow (T + 1) | 1,080 | |||||||||
| Terminal Value | 19,697 | |||||||||
| Present Terminal Value | 12,520 | |||||||||
| Enterprise Value | 15,809 | |||||||||
| Net Debt | -606 | |||||||||
| Equity Value | 16,414 | |||||||||
| Diluted Shares Outstanding, MM | 88 | |||||||||
| Equity Value Per Share | 186.75 |
What You Will Get
- Editable Excel Template: A fully customizable Excel-based DCF Calculator featuring pre-filled real ANSYS financials.
- Real-World Data: Historical data and forward-looking estimates (as indicated in the yellow cells).
- Forecast Flexibility: Adjust forecast assumptions such as revenue growth, EBITDA %, and WACC.
- Automatic Calculations: Instantly observe the effect of your inputs on ANSYS’s valuation.
- Professional Tool: Designed for investors, CFOs, consultants, and financial analysts.
- User-Friendly Design: Organized for clarity and ease of use, complete with step-by-step instructions.
Key Features
- Customizable Simulation Parameters: Adjust essential inputs such as simulation time, mesh size, and solver settings.
- Instantaneous Results Generation: Produces simulation results and insights in real-time.
- Industry-Leading Precision: Utilizes ANSYS’s advanced algorithms for accurate modeling outcomes.
- Comprehensive Scenario Testing: Easily evaluate various design scenarios and compare results effectively.
- Efficiency Booster: Streamline the simulation process without the need for extensive manual configurations.
How It Works
- Step 1: Download the Excel file.
- Step 2: Review pre-entered ANSYS data (historical and projected).
- Step 3: Adjust key assumptions (yellow cells) based on your analysis.
- Step 4: View automatic recalculations for ANSYS’s intrinsic value.
- Step 5: Use the outputs for investment decisions or reporting.
Why Choose ANSYS, Inc. (ANSS)?
- Accelerate Development: Streamlined simulation tools save you valuable time in product design.
- Enhance Precision: Advanced algorithms and reliable data ensure accurate simulation results.
- Highly Adaptable: Customize simulations to meet specific project requirements and industry standards.
- User-Friendly Interface: Intuitive dashboards and visualizations simplify complex data analysis.
- Preferred by Industry Leaders: Trusted by top engineers and organizations for their critical simulation needs.
Who Should Use ANSYS, Inc. (ANSS)?
- Engineers: Enhance your design process with advanced simulation tools for accurate modeling.
- Researchers: Leverage powerful analytics to validate hypotheses and drive innovation.
- Product Developers: Streamline product testing and optimization with integrated simulation capabilities.
- Educators and Students: Utilize cutting-edge software to enrich learning experiences in engineering and technology.
- Consultants: Provide clients with data-driven insights and recommendations using sophisticated simulation results.
What the Template Contains
- Historical Data: Includes ANSYS, Inc.'s (ANSS) past financials and baseline forecasts.
- DCF and Levered DCF Models: Detailed templates to calculate ANSYS, Inc.'s (ANSS) intrinsic value.
- WACC Sheet: Pre-built calculations for Weighted Average Cost of Capital.
- Editable Inputs: Modify key drivers like growth rates, EBITDA %, and CAPEX assumptions.
- Quarterly and Annual Statements: A complete breakdown of ANSYS, Inc.'s (ANSS) financials.
- Interactive Dashboard: Visualize valuation results and projections dynamically.
Disclaimer
All information, articles, and product details provided on this website are for general informational and educational purposes only. We do not claim any ownership over, nor do we intend to infringe upon, any trademarks, copyrights, logos, brand names, or other intellectual property mentioned or depicted on this site. Such intellectual property remains the property of its respective owners, and any references here are made solely for identification or informational purposes, without implying any affiliation, endorsement, or partnership.
We make no representations or warranties, express or implied, regarding the accuracy, completeness, or suitability of any content or products presented. Nothing on this website should be construed as legal, tax, investment, financial, medical, or other professional advice. In addition, no part of this site—including articles or product references—constitutes a solicitation, recommendation, endorsement, advertisement, or offer to buy or sell any securities, franchises, or other financial instruments, particularly in jurisdictions where such activity would be unlawful.
All content is of a general nature and may not address the specific circumstances of any individual or entity. It is not a substitute for professional advice or services. Any actions you take based on the information provided here are strictly at your own risk. You accept full responsibility for any decisions or outcomes arising from your use of this website and agree to release us from any liability in connection with your use of, or reliance upon, the content or products found herein.