
|
Aon plc (aon) DCF -Bewertung |
Fully Editable: Tailor To Your Needs In Excel Or Sheets
Professional Design: Trusted, Industry-Standard Templates
Investor-Approved Valuation Models
MAC/PC Compatible, Fully Unlocked
No Expertise Is Needed; Easy To Follow
Aon plc (AON) Bundle
Möchten Sie den inneren Wert von AON SPS bestimmen? Unser AON DCF-Taschenrechner integriert reale Daten mit umfangreichen Anpassungsfunktionen, sodass Sie Prognosen verfeinern und Ihre Anlagestrategien verbessern können.
What You Will Get
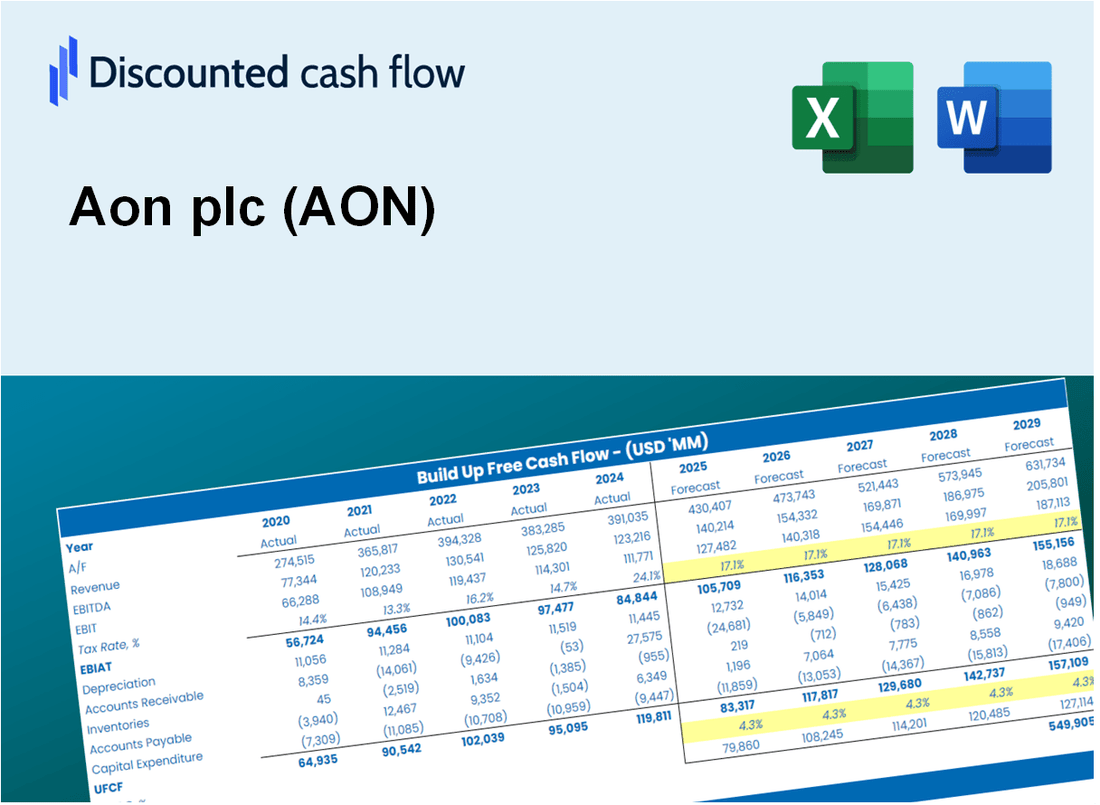
- Editable Excel Template: A fully customizable Excel-based DCF Calculator featuring pre-filled real AON financials.
- Real-World Data: Historical data and forward-looking estimates (as highlighted in the yellow cells).
- Forecast Flexibility: Adjust forecast assumptions such as revenue growth, EBITDA %, and WACC.
- Automatic Calculations: Instantly observe the effect of your inputs on Aon's valuation.
- Professional Tool: Designed for investors, CFOs, consultants, and financial analysts.
- User-Friendly Design: Organized for clarity and ease of use, complete with step-by-step instructions.
Key Features
- Comprehensive Risk Assessment Tools: Offers in-depth analysis for various risk management scenarios.
- Customizable Insurance Solutions: Tailor insurance products to meet specific client needs.
- Data-Driven Insights: Utilize advanced analytics to drive decision-making and enhance client strategies.
- Integrated Technology Platforms: Streamlined systems for efficient management of insurance and risk services.
- Client Dashboard: Visual interface providing real-time updates on risk profiles and insurance coverage for Aon plc (AON).
How It Works
- 1. Access the Template: Download and open the Excel file containing Aon plc’s (AON) preloaded data.
- 2. Modify Assumptions: Adjust key inputs such as growth rates, WACC, and capital expenditures.
- 3. See Results Immediately: The DCF model automatically calculates intrinsic value and NPV.
- 4. Explore Scenarios: Evaluate multiple forecasts to assess different valuation possibilities.
- 5. Present with Assurance: Deliver professional valuation insights to back your decisions.
Why Choose Aon plc (AON)?
- Streamlined Processes: Eliminate the hassle of complex calculations with our user-friendly tools.
- Enhanced Precision: Access to accurate market data ensures dependable insights for your decisions.
- Fully Adaptable: Modify our solutions to fit your unique business needs and forecasts.
- Clear Visualization: Intuitive graphs and outputs simplify data interpretation for better understanding.
- Backed by Professionals: Our services are crafted for industry experts who prioritize accuracy and efficiency.
Who Should Use This Product?
- Investors: Accurately assess Aon's fair value before making investment choices.
- CFOs: Utilize a professional-grade DCF model for financial reporting and analysis.
- Consultants: Efficiently customize the template for valuation reports for clients.
- Entrepreneurs: Acquire insights into financial modeling practices employed by leading firms.
- Educators: Implement it as a teaching resource to illustrate valuation methodologies.
What the Template Contains
- Pre-Filled DCF Model: Aon’s financial data preloaded for immediate use.
- WACC Calculator: Detailed calculations for Weighted Average Cost of Capital.
- Financial Ratios: Evaluate Aon’s profitability, leverage, and efficiency.
- Editable Inputs: Change assumptions such as growth, margins, and CAPEX to fit your scenarios.
- Financial Statements: Annual and quarterly reports to support detailed analysis.
- Interactive Dashboard: Easily visualize key valuation metrics and results.
Disclaimer
All information, articles, and product details provided on this website are for general informational and educational purposes only. We do not claim any ownership over, nor do we intend to infringe upon, any trademarks, copyrights, logos, brand names, or other intellectual property mentioned or depicted on this site. Such intellectual property remains the property of its respective owners, and any references here are made solely for identification or informational purposes, without implying any affiliation, endorsement, or partnership.
We make no representations or warranties, express or implied, regarding the accuracy, completeness, or suitability of any content or products presented. Nothing on this website should be construed as legal, tax, investment, financial, medical, or other professional advice. In addition, no part of this site—including articles or product references—constitutes a solicitation, recommendation, endorsement, advertisement, or offer to buy or sell any securities, franchises, or other financial instruments, particularly in jurisdictions where such activity would be unlawful.
All content is of a general nature and may not address the specific circumstances of any individual or entity. It is not a substitute for professional advice or services. Any actions you take based on the information provided here are strictly at your own risk. You accept full responsibility for any decisions or outcomes arising from your use of this website and agree to release us from any liability in connection with your use of, or reliance upon, the content or products found herein.