
|
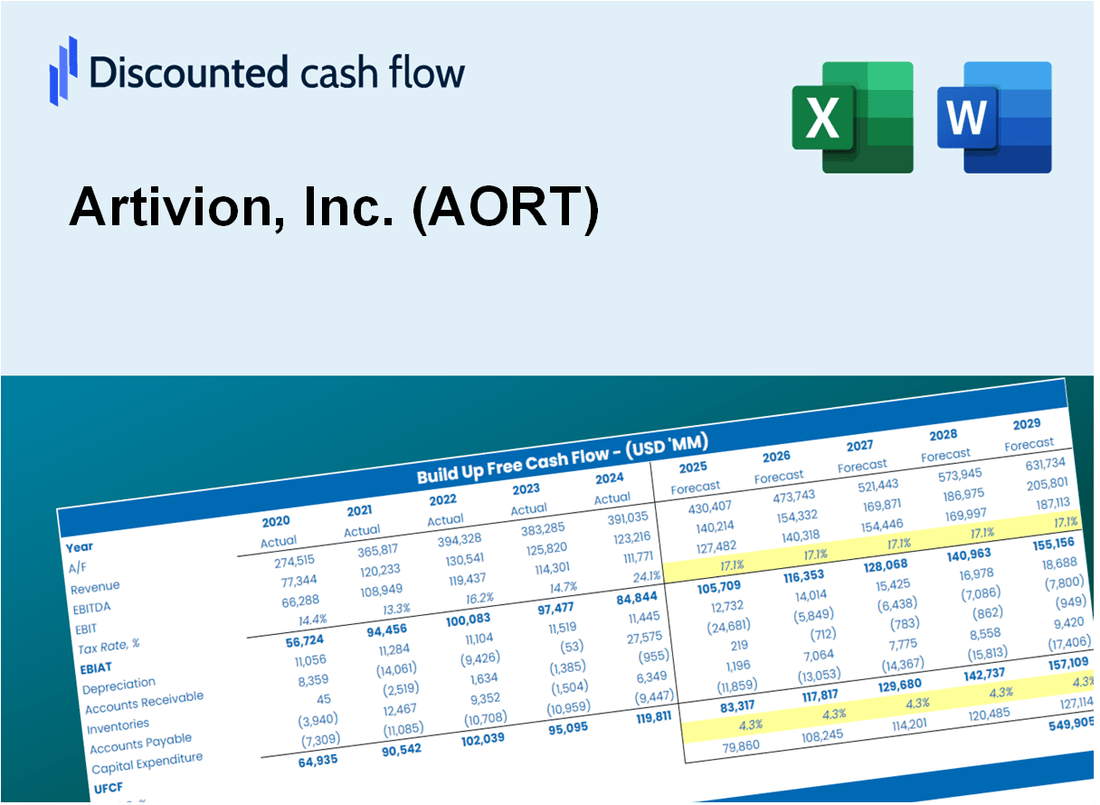
Artivion, Inc. (Aort) DCF -Bewertung |
Fully Editable: Tailor To Your Needs In Excel Or Sheets
Professional Design: Trusted, Industry-Standard Templates
Investor-Approved Valuation Models
MAC/PC Compatible, Fully Unlocked
No Expertise Is Needed; Easy To Follow
Artivion, Inc. (AORT) Bundle
Entdecken Sie das finanzielle Potenzial von Artivion, Inc. (AORT) mit unserem benutzerfreundlichen DCF-Taschenrechner! Geben Sie Ihre Prognosen für Wachstum, Margen und Kosten ein, um den inneren Wert von Artivion, Inc. (AORT) zu bestimmen und Ihren Investitionsansatz zu verbessern.
What You Will Get
- Editable Excel Template: A fully customizable Excel-based DCF Calculator featuring pre-filled real AORT financials.
- Real-World Data: Historical data and forward-looking estimates (as indicated in the highlighted cells).
- Forecast Flexibility: Adjust forecast assumptions such as revenue growth, EBITDA %, and WACC.
- Automatic Calculations: Instantly observe the effects of your inputs on Artivion’s valuation.
- Professional Tool: Designed for investors, CFOs, consultants, and financial analysts.
- User-Friendly Design: Organized for clarity and ease of use, complete with step-by-step instructions.
Key Features
- 🔍 Real-Life AORT Financials: Pre-filled historical and projected data for Artivion, Inc. (AORT).
- ✏️ Fully Customizable Inputs: Adjust all critical parameters (yellow cells) like WACC, growth %, and tax rates.
- 📊 Professional DCF Valuation: Built-in formulas calculate Artivion’s intrinsic value using the Discounted Cash Flow method.
- ⚡ Instant Results: Visualize Artivion’s valuation instantly after making changes.
- Scenario Analysis: Test and compare outcomes for various financial assumptions side-by-side.
How It Works
- Step 1: Download the Excel file.
- Step 2: Review Artivion, Inc.'s pre-filled financial data and forecasts.
- Step 3: Modify critical inputs like revenue growth, WACC, and tax rates (highlighted cells).
- Step 4: Watch the DCF model update instantly as you tweak assumptions.
- Step 5: Analyze the outputs and use the results for investment decisions regarding Artivion, Inc. (AORT).
Why Choose Artivion, Inc. (AORT)?
- Save Time: Quickly access advanced solutions without starting from scratch.
- Enhance Precision: Dependable data and methodologies minimize valuation errors.
- Completely Customizable: Adjust the tools to align with your specific assumptions and forecasts.
- User-Friendly: Intuitive visuals and outputs facilitate straightforward analysis of results.
- Endorsed by Professionals: Crafted for industry experts who prioritize accuracy and functionality.
Who Should Use This Product?
- Finance Students: Explore advanced valuation methodologies and practice with actual market data for Artivion, Inc. (AORT).
- Academics: Integrate industry-standard valuation models into your lectures or research focused on Artivion, Inc. (AORT).
- Investors: Validate your investment strategies and evaluate valuation scenarios for Artivion, Inc. (AORT).
- Analysts: Enhance your analysis efficiency with a ready-to-use, customizable DCF model tailored for Artivion, Inc. (AORT).
- Small Business Owners: Understand the analytical approaches used for large public firms like Artivion, Inc. (AORT).
What the Template Contains
- Pre-Filled DCF Model: Artivion, Inc.’s (AORT) financial data preloaded for immediate use.
- WACC Calculator: Detailed calculations for Weighted Average Cost of Capital.
- Financial Ratios: Evaluate Artivion, Inc.’s (AORT) profitability, leverage, and efficiency.
- Editable Inputs: Change assumptions such as growth, margins, and CAPEX to fit your scenarios.
- Financial Statements: Annual and quarterly reports to support detailed analysis.
- Interactive Dashboard: Easily visualize key valuation metrics and results.
Disclaimer
All information, articles, and product details provided on this website are for general informational and educational purposes only. We do not claim any ownership over, nor do we intend to infringe upon, any trademarks, copyrights, logos, brand names, or other intellectual property mentioned or depicted on this site. Such intellectual property remains the property of its respective owners, and any references here are made solely for identification or informational purposes, without implying any affiliation, endorsement, or partnership.
We make no representations or warranties, express or implied, regarding the accuracy, completeness, or suitability of any content or products presented. Nothing on this website should be construed as legal, tax, investment, financial, medical, or other professional advice. In addition, no part of this site—including articles or product references—constitutes a solicitation, recommendation, endorsement, advertisement, or offer to buy or sell any securities, franchises, or other financial instruments, particularly in jurisdictions where such activity would be unlawful.
All content is of a general nature and may not address the specific circumstances of any individual or entity. It is not a substitute for professional advice or services. Any actions you take based on the information provided here are strictly at your own risk. You accept full responsibility for any decisions or outcomes arising from your use of this website and agree to release us from any liability in connection with your use of, or reliance upon, the content or products found herein.