
|
American Outdoor Brands, Inc. (AOUT) DCF -Bewertung |
Fully Editable: Tailor To Your Needs In Excel Or Sheets
Professional Design: Trusted, Industry-Standard Templates
Investor-Approved Valuation Models
MAC/PC Compatible, Fully Unlocked
No Expertise Is Needed; Easy To Follow
American Outdoor Brands, Inc. (AOUT) Bundle
Übernehmen Sie die Bewertungsanalyse für Ihre American Outdoor Brands, Inc. (AOUT) mit unserem ausgeklügelten DCF -Taschenrechner! Diese Excel -Vorlage mit realen (AOUT-) Daten ermöglicht es Ihnen, Prognosen und Annahmen anzupassen, um den inneren Wert von American Outdoor Brands, Inc. (AOUT) genau zu bestimmen.
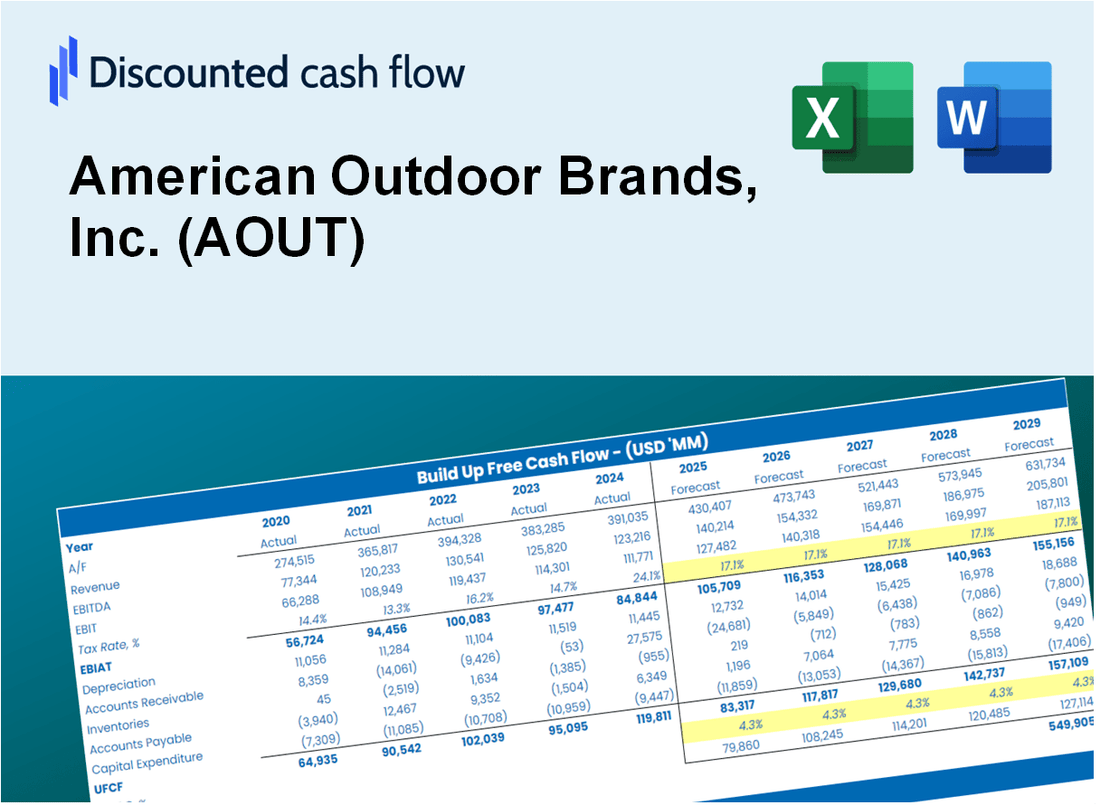
Discounted Cash Flow (DCF) - (USD MM)
| Year | AY1 2021 |
AY2 2022 |
AY3 2023 |
AY4 2024 |
AY5 2025 |
FY1 2026 |
FY2 2027 |
FY3 2028 |
FY4 2029 |
FY5 2030 |
|---|---|---|---|---|---|---|---|---|---|---|
| Revenue | 276.7 | 247.5 | 191.2 | 201.1 | 222.3 | 212.6 | 203.2 | 194.3 | 185.8 | 177.6 |
| Revenue Growth, % | 0 | -10.54 | -22.75 | 5.17 | 10.55 | -4.39 | -4.39 | -4.39 | -4.39 | -4.39 |
| EBITDA | 43.3 | -38.2 | 5.0 | 3.6 | 13.1 | 4.5 | 4.3 | 4.1 | 3.9 | 3.7 |
| EBITDA, % | 15.66 | -15.45 | 2.61 | 1.79 | 5.9 | 2.1 | 2.1 | 2.1 | 2.1 | 2.1 |
| Depreciation | 19.8 | 17.0 | 16.5 | 16.1 | 13.3 | 15.6 | 14.9 | 14.2 | 13.6 | 13.0 |
| Depreciation, % | 7.17 | 6.85 | 8.64 | 8.01 | 5.97 | 7.33 | 7.33 | 7.33 | 7.33 | 7.33 |
| EBIT | 23.5 | -55.2 | -11.5 | -12.5 | -.2 | -11.1 | -10.6 | -10.1 | -9.7 | -9.3 |
| EBIT, % | 8.49 | -22.31 | -6.02 | -6.21 | -0.0692689 | -5.22 | -5.22 | -5.22 | -5.22 | -5.22 |
| Total Cash | 60.8 | 19.5 | 22.0 | 29.7 | 23.4 | 28.3 | 27.1 | 25.9 | 24.8 | 23.7 |
| Total Cash, percent | .0 | .0 | .0 | .0 | .0 | .0 | .0 | .0 | .0 | .0 |
| Account Receivables | 37.6 | 30.1 | 28.1 | 26.0 | 39.5 | 30.2 | 28.9 | 27.6 | 26.4 | 25.3 |
| Account Receivables, % | 13.6 | 12.16 | 14.69 | 12.9 | 17.76 | 14.22 | 14.22 | 14.22 | 14.22 | 14.22 |
| Inventories | 74.3 | 121.7 | 99.7 | 93.3 | 104.7 | 94.2 | 90.1 | 86.1 | 82.4 | 78.7 |
| Inventories, % | 26.85 | 49.16 | 52.16 | 46.4 | 47.1 | 44.34 | 44.34 | 44.34 | 44.34 | 44.34 |
| Accounts Payable | 16.0 | 13.6 | 11.5 | 14.2 | 15.7 | 13.4 | 12.8 | 12.2 | 11.7 | 11.2 |
| Accounts Payable, % | 5.79 | 5.48 | 6.04 | 7.06 | 7.07 | 6.29 | 6.29 | 6.29 | 6.29 | 6.29 |
| Capital Expenditure | -4.2 | -6.6 | -4.9 | -6.1 | -3.9 | -4.9 | -4.7 | -4.5 | -4.3 | -4.1 |
| Capital Expenditure, % | -1.51 | -2.66 | -2.54 | -3.04 | -1.75 | -2.3 | -2.3 | -2.3 | -2.3 | -2.3 |
| Tax Rate, % | 267.39 | 267.39 | 267.39 | 267.39 | 267.39 | 267.39 | 267.39 | 267.39 | 267.39 | 267.39 |
| EBITAT | 17.8 | -64.5 | -11.3 | -12.4 | .3 | -8.3 | -7.9 | -7.6 | -7.2 | -6.9 |
| Depreciation | ||||||||||
| Changes in Account Receivables | ||||||||||
| Changes in Inventories | ||||||||||
| Changes in Accounts Payable | ||||||||||
| Capital Expenditure | ||||||||||
| UFCF | -62.5 | -96.4 | 22.3 | 8.8 | -13.8 | 19.8 | 7.2 | 6.9 | 6.6 | 6.3 |
| WACC, % | 4.96 | 5.22 | 5.2 | 5.21 | 4.15 | 4.95 | 4.95 | 4.95 | 4.95 | 4.95 |
| PV UFCF | ||||||||||
| SUM PV UFCF | 41.6 | |||||||||
| Long Term Growth Rate, % | 4.00 | |||||||||
| Free cash flow (T + 1) | 7 | |||||||||
| Terminal Value | 688 | |||||||||
| Present Terminal Value | 540 | |||||||||
| Enterprise Value | 582 | |||||||||
| Net Debt | 10 | |||||||||
| Equity Value | 572 | |||||||||
| Diluted Shares Outstanding, MM | 13 | |||||||||
| Equity Value Per Share | 44.66 |
What You Will Get
- Editable Excel Template: A fully customizable Excel-based DCF Calculator featuring pre-filled real AOUT financials.
- Real-World Data: Historical data and forward-looking estimates (as indicated in the yellow cells).
- Forecast Flexibility: Adjust forecast assumptions such as revenue growth, EBITDA %, and WACC.
- Automatic Calculations: Instantly observe how your inputs affect American Outdoor Brands' valuation.
- Professional Tool: Designed for investors, CFOs, consultants, and financial analysts.
- User-Friendly Design: Organized for clarity and ease of use, complete with step-by-step instructions.
Key Features
- Pre-Loaded Data: American Outdoor Brands, Inc.'s (AOUT) historical financial statements and pre-filled forecasts.
- Fully Adjustable Inputs: Edit WACC, tax rates, revenue growth, and EBITDA margins tailored to AOUT.
- Instant Results: View American Outdoor Brands' intrinsic value recalculating in real time.
- Clear Visual Outputs: Dashboard charts showcase valuation results and key metrics for AOUT.
- Built for Accuracy: A professional tool designed for analysts, investors, and finance experts focusing on AOUT.
How It Works
- Step 1: Download the prebuilt Excel template with American Outdoor Brands, Inc. (AOUT) data included.
- Step 2: Explore the pre-filled sheets and familiarize yourself with the key metrics.
- Step 3: Update forecasts and assumptions in the editable yellow cells (WACC, growth, margins).
- Step 4: Instantly view recalculated results, including American Outdoor Brands, Inc. (AOUT)'s intrinsic value.
- Step 5: Make informed investment decisions or generate reports using the outputs.
Why Choose American Outdoor Brands, Inc. (AOUT)?
- Quality Products: Our outdoor gear is built to last, ensuring reliability in every adventure.
- Innovative Designs: We continuously evolve our products to meet the needs of outdoor enthusiasts.
- Wide Selection: From firearms to outdoor accessories, we offer a comprehensive range of products.
- Commitment to Safety: Our products adhere to the highest safety standards for peace of mind.
- Community Focused: We support outdoor conservation efforts and promote responsible recreation.
Who Should Use This Product?
- Investors: Accurately estimate American Outdoor Brands, Inc.'s (AOUT) fair value before making investment decisions.
- CFOs: Utilize a professional-grade DCF model for financial reporting and analysis specific to AOUT.
- Consultants: Quickly adapt the template for valuation reports tailored to AOUT clients.
- Entrepreneurs: Gain insights into financial modeling practices employed by leading outdoor brands.
- Educators: Use it as a teaching tool to illustrate valuation methodologies relevant to the outdoor industry.
What the Template Contains
- Preloaded AOUT Data: Historical and projected financial data, including revenue, EBIT, and capital expenditures.
- DCF and WACC Models: Professional-grade sheets for calculating intrinsic value and Weighted Average Cost of Capital.
- Editable Inputs: Yellow-highlighted cells for adjusting revenue growth, tax rates, and discount rates.
- Financial Statements: Comprehensive annual and quarterly financials for deeper analysis.
- Key Ratios: Profitability, leverage, and efficiency ratios to evaluate performance.
- Dashboard and Charts: Visual summaries of valuation outcomes and assumptions.
Disclaimer
All information, articles, and product details provided on this website are for general informational and educational purposes only. We do not claim any ownership over, nor do we intend to infringe upon, any trademarks, copyrights, logos, brand names, or other intellectual property mentioned or depicted on this site. Such intellectual property remains the property of its respective owners, and any references here are made solely for identification or informational purposes, without implying any affiliation, endorsement, or partnership.
We make no representations or warranties, express or implied, regarding the accuracy, completeness, or suitability of any content or products presented. Nothing on this website should be construed as legal, tax, investment, financial, medical, or other professional advice. In addition, no part of this site—including articles or product references—constitutes a solicitation, recommendation, endorsement, advertisement, or offer to buy or sell any securities, franchises, or other financial instruments, particularly in jurisdictions where such activity would be unlawful.
All content is of a general nature and may not address the specific circumstances of any individual or entity. It is not a substitute for professional advice or services. Any actions you take based on the information provided here are strictly at your own risk. You accept full responsibility for any decisions or outcomes arising from your use of this website and agree to release us from any liability in connection with your use of, or reliance upon, the content or products found herein.