
|
APA Corporation (APA) DCF -Bewertung |
Fully Editable: Tailor To Your Needs In Excel Or Sheets
Professional Design: Trusted, Industry-Standard Templates
Investor-Approved Valuation Models
MAC/PC Compatible, Fully Unlocked
No Expertise Is Needed; Easy To Follow
APA Corporation (APA) Bundle
Bewerten Sie die finanziellen Aussichten der APA Corporation wie ein Experte! Dieser (APA) DCF-Taschenrechner bietet vorgefüllte Finanzdaten zusammen mit der Flexibilität, das Umsatzwachstum, WACC, Margen und andere wesentliche Annahmen zu ändern, um sich an Ihren Projektionen anzupassen.
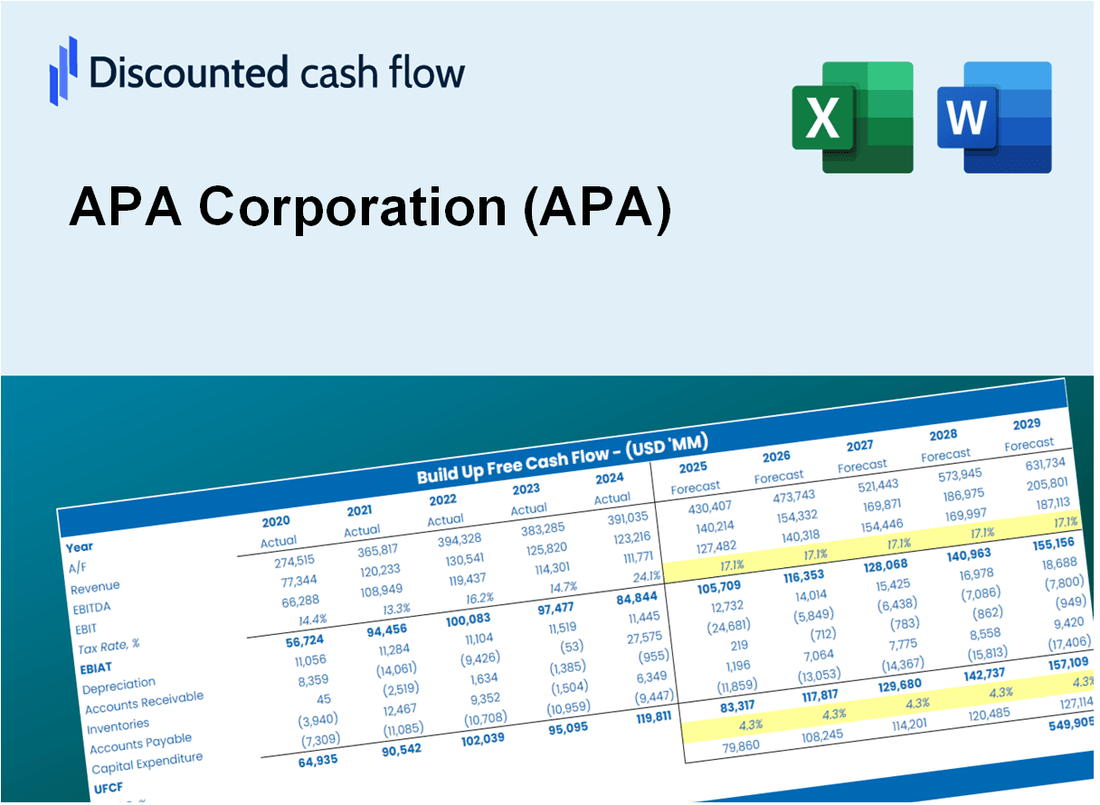
Discounted Cash Flow (DCF) - (USD MM)
| Year | AY1 2020 |
AY2 2021 |
AY3 2022 |
AY4 2023 |
AY5 2024 |
FY1 2025 |
FY2 2026 |
FY3 2027 |
FY4 2028 |
FY5 2029 |
|---|---|---|---|---|---|---|---|---|---|---|
| Revenue | 4,435.0 | 7,985.0 | 11,075.0 | 8,279.0 | 9,737.0 | 12,441.6 | 15,897.5 | 20,313.4 | 25,955.8 | 33,165.5 |
| Revenue Growth, % | 0 | 80.05 | 38.7 | -25.25 | 17.61 | 27.78 | 27.78 | 27.78 | 27.78 | 27.78 |
| EBITDA | -2,642.0 | 3,661.0 | 7,613.0 | 4,750.0 | 4,174.0 | 3,863.3 | 4,936.5 | 6,307.7 | 8,059.7 | 10,298.5 |
| EBITDA, % | -59.57 | 45.85 | 68.74 | 57.37 | 42.87 | 31.05 | 31.05 | 31.05 | 31.05 | 31.05 |
| Depreciation | 1,772.0 | 1,360.0 | 1,557.0 | 1,540.0 | 2,266.0 | 2,809.8 | 3,590.3 | 4,587.5 | 5,861.8 | 7,490.0 |
| Depreciation, % | 39.95 | 17.03 | 14.06 | 18.6 | 23.27 | 22.58 | 22.58 | 22.58 | 22.58 | 22.58 |
| EBIT | -4,414.0 | 2,301.0 | 6,056.0 | 3,210.0 | 1,908.0 | 1,053.6 | 1,346.2 | 1,720.1 | 2,197.9 | 2,808.4 |
| EBIT, % | -99.53 | 28.82 | 54.68 | 38.77 | 19.6 | 8.47 | 8.47 | 8.47 | 8.47 | 8.47 |
| Total Cash | 262.0 | 302.0 | 245.0 | 87.0 | 625.0 | 482.0 | 615.9 | 787.0 | 1,005.6 | 1,284.9 |
| Total Cash, percent | .0 | .0 | .0 | .0 | .0 | .0 | .0 | .0 | .0 | .0 |
| Account Receivables | 908.0 | 1,394.0 | 1,466.0 | 1,610.0 | 1,959.0 | 2,257.8 | 2,884.9 | 3,686.2 | 4,710.2 | 6,018.5 |
| Account Receivables, % | 20.47 | 17.46 | 13.24 | 19.45 | 20.12 | 18.15 | 18.15 | 18.15 | 18.15 | 18.15 |
| Inventories | 492.0 | 473.0 | 427.0 | 453.0 | 425.0 | 764.1 | 976.4 | 1,247.6 | 1,594.2 | 2,037.0 |
| Inventories, % | 11.09 | 5.92 | 3.86 | 5.47 | 4.36 | 6.14 | 6.14 | 6.14 | 6.14 | 6.14 |
| Accounts Payable | 444.0 | 731.0 | 771.0 | 658.0 | 1,224.0 | 1,160.7 | 1,483.1 | 1,895.1 | 2,421.5 | 3,094.1 |
| Accounts Payable, % | 10.01 | 9.15 | 6.96 | 7.95 | 12.57 | 9.33 | 9.33 | 9.33 | 9.33 | 9.33 |
| Capital Expenditure | -1,274.0 | -1,110.0 | -2,398.0 | -2,357.0 | -2,851.0 | -3,036.5 | -3,879.9 | -4,957.6 | -6,334.7 | -8,094.3 |
| Capital Expenditure, % | -28.73 | -13.9 | -21.65 | -28.47 | -29.28 | -24.41 | -24.41 | -24.41 | -24.41 | -24.41 |
| Tax Rate, % | 47.62 | 47.62 | 47.62 | 47.62 | 47.62 | 47.62 | 47.62 | 47.62 | 47.62 | 47.62 |
| EBITAT | -4,362.9 | 1,381.1 | 3,880.3 | 3,178.8 | 999.4 | 788.8 | 1,007.9 | 1,287.8 | 1,645.6 | 2,102.7 |
| Depreciation | ||||||||||
| Changes in Account Receivables | ||||||||||
| Changes in Inventories | ||||||||||
| Changes in Accounts Payable | ||||||||||
| Capital Expenditure | ||||||||||
| UFCF | -4,820.9 | 1,451.1 | 3,053.3 | 2,078.8 | 659.4 | -139.1 | 201.2 | 257.1 | 328.6 | 419.8 |
| WACC, % | 6.82 | 5.83 | 5.94 | 6.82 | 5.64 | 6.21 | 6.21 | 6.21 | 6.21 | 6.21 |
| PV UFCF | ||||||||||
| SUM PV UFCF | 830.8 | |||||||||
| Long Term Growth Rate, % | 0.50 | |||||||||
| Free cash flow (T + 1) | 422 | |||||||||
| Terminal Value | 7,388 | |||||||||
| Present Terminal Value | 5,467 | |||||||||
| Enterprise Value | 6,297 | |||||||||
| Net Debt | 5,537 | |||||||||
| Equity Value | 760 | |||||||||
| Diluted Shares Outstanding, MM | 353 | |||||||||
| Equity Value Per Share | 2.15 |
What You Will Get
- Pre-Filled Financial Model: APA Corporation’s actual data facilitates accurate DCF valuation.
- Full Forecast Control: Modify revenue growth, margins, WACC, and other essential drivers.
- Instant Calculations: Automatic updates provide immediate results as you make adjustments.
- Investor-Ready Template: A polished Excel file crafted for high-quality valuation.
- Customizable and Reusable: Designed for flexibility, allowing repeated use for comprehensive forecasts.
Key Features
- Accurate APA Financials: Gain access to reliable pre-loaded historical data and future forecasts.
- Tailorable Forecast Assumptions: Modify highlighted cells such as WACC, growth rates, and profit margins.
- Real-Time Calculations: Automatic adjustments to DCF, Net Present Value (NPV), and cash flow assessments.
- Interactive Dashboard: User-friendly charts and summaries to help visualize your valuation outcomes.
- Suitable for All Levels: An intuitive design catered to investors, CFOs, and consultants alike.
How It Works
- Step 1: Download the Excel file for APA Corporation (APA).
- Step 2: Review APA's pre-filled financial data and projections.
- Step 3: Adjust key inputs such as revenue growth, WACC, and tax rates (highlighted cells).
- Step 4: Observe the DCF model update in real-time as you modify assumptions.
- Step 5: Evaluate the outputs and utilize the results for your investment strategies.
Why Choose This Calculator for APA Corporation (APA)?
- User-Friendly Interface: Perfect for both novices and seasoned professionals.
- Customizable Inputs: Adjust parameters easily to suit your financial analysis.
- Real-Time Valuation: Observe immediate updates to APA's valuation as you change inputs.
- Preloaded Data: Comes with APA’s actual financial metrics for swift evaluations.
- Preferred by Experts: Utilized by analysts and investors to guide their decisions.
Who Should Use This Product?
- Investors: Accurately estimate APA Corporation’s fair value before making investment decisions.
- CFOs: Leverage a professional-grade DCF model for financial reporting and analysis related to APA (APA).
- Consultants: Quickly adapt the template for valuation reports tailored for clients in the energy sector.
- Entrepreneurs: Gain insights into financial modeling practices utilized by leading companies like APA (APA).
- Educators: Use it as a teaching tool to demonstrate valuation methodologies relevant to the oil and gas industry.
What the Template Contains
- Pre-Filled Data: Includes APA Corporation’s historical financials and forecasts.
- Discounted Cash Flow Model: Editable DCF valuation model with automatic calculations.
- Weighted Average Cost of Capital (WACC): A dedicated sheet for calculating WACC based on custom inputs.
- Key Financial Ratios: Analyze APA Corporation’s profitability, efficiency, and leverage.
- Customizable Inputs: Edit revenue growth, margins, and tax rates with ease.
- Clear Dashboard: Charts and tables summarizing key valuation results.
Disclaimer
All information, articles, and product details provided on this website are for general informational and educational purposes only. We do not claim any ownership over, nor do we intend to infringe upon, any trademarks, copyrights, logos, brand names, or other intellectual property mentioned or depicted on this site. Such intellectual property remains the property of its respective owners, and any references here are made solely for identification or informational purposes, without implying any affiliation, endorsement, or partnership.
We make no representations or warranties, express or implied, regarding the accuracy, completeness, or suitability of any content or products presented. Nothing on this website should be construed as legal, tax, investment, financial, medical, or other professional advice. In addition, no part of this site—including articles or product references—constitutes a solicitation, recommendation, endorsement, advertisement, or offer to buy or sell any securities, franchises, or other financial instruments, particularly in jurisdictions where such activity would be unlawful.
All content is of a general nature and may not address the specific circumstances of any individual or entity. It is not a substitute for professional advice or services. Any actions you take based on the information provided here are strictly at your own risk. You accept full responsibility for any decisions or outcomes arising from your use of this website and agree to release us from any liability in connection with your use of, or reliance upon, the content or products found herein.