
|
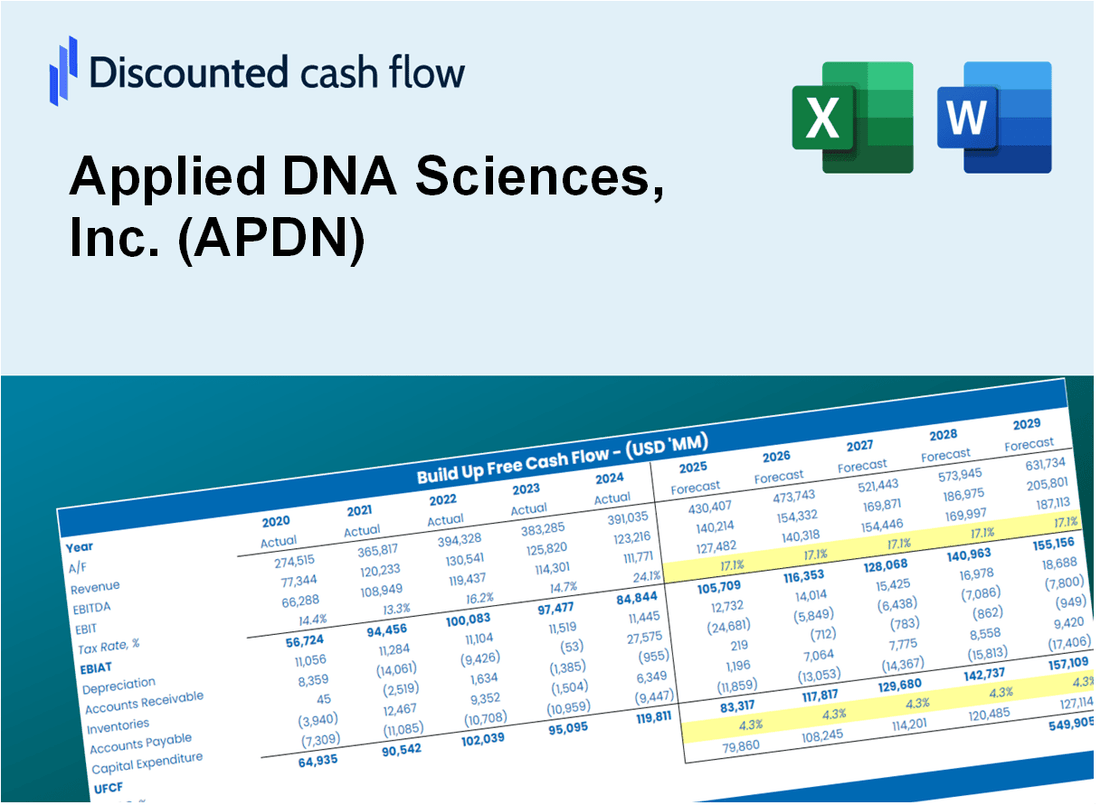
Angewandte DNA Sciences, Inc. (APDN) DCF -Bewertung |
Fully Editable: Tailor To Your Needs In Excel Or Sheets
Professional Design: Trusted, Industry-Standard Templates
Investor-Approved Valuation Models
MAC/PC Compatible, Fully Unlocked
No Expertise Is Needed; Easy To Follow
Applied DNA Sciences, Inc. (APDN) Bundle
Unabhängig davon, ob Sie ein Investor oder ein Analyst sind, ist dieser (APDN) DCF-Taschenrechner Ihre Anlaufstelle für eine genaue Bewertung. Mit realen Daten von Applied DNA Sciences, Inc. geladen, können Sie Prognosen anpassen und die Effekte in Echtzeit beobachten.
What You Will Get
- Real APDN Financial Data: Pre-filled with Applied DNA Sciences’ historical and projected data for precise analysis.
- Fully Editable Template: Modify key inputs like revenue growth, WACC, and EBITDA % with ease.
- Automatic Calculations: See Applied DNA Sciences’ intrinsic value update instantly based on your changes.
- Professional Valuation Tool: Designed for investors, analysts, and consultants seeking accurate DCF results.
- User-Friendly Design: Simple structure and clear instructions for all experience levels.
Key Features
- Comprehensive DCF Calculator: Features both unlevered and levered DCF valuation models tailored for Applied DNA Sciences, Inc. (APDN).
- WACC Calculator: Ready-to-use Weighted Average Cost of Capital sheet with adjustable parameters.
- Customizable Forecast Assumptions: Adjust growth projections, capital expenditures, and discount rates as needed.
- Integrated Financial Ratios: Evaluate profitability, leverage, and efficiency ratios specific to Applied DNA Sciences, Inc. (APDN).
- Interactive Dashboard and Charts: Visual representations that condense key valuation metrics for straightforward analysis.
How It Works
- Step 1: Download the Excel file.
- Step 2: Review pre-entered Applied DNA Sciences data (historical and projected).
- Step 3: Adjust key assumptions (yellow cells) based on your analysis.
- Step 4: View automatic recalculations for Applied DNA Sciences’ intrinsic value.
- Step 5: Use the outputs for investment decisions or reporting.
Why Choose This Calculator?
- User-Friendly Interface: Tailored for both novices and seasoned professionals.
- Customizable Inputs: Adjust parameters effortlessly to suit your analytical needs.
- Real-Time Valuation: Observe immediate updates to Applied DNA Sciences’ valuation as you tweak inputs.
- Preloaded Financials: Comes with Applied DNA Sciences’ (APDN) actual financial data for swift evaluations.
- Relied Upon by Experts: Utilized by investors and analysts for making well-informed choices.
Who Should Use This Product?
- Investors: Evaluate Applied DNA Sciences, Inc. (APDN) for informed investment decisions.
- CFOs and Financial Analysts: Enhance valuation methodologies and assess financial forecasts.
- Startup Founders: Gain insights into the valuation strategies of established companies like Applied DNA Sciences, Inc. (APDN).
- Consultants: Provide comprehensive valuation analyses for clients in the biotech sector.
- Students and Educators: Utilize actual market data to learn and teach valuation practices.
What the Template Contains
- Historical Data: Includes Applied DNA Sciences, Inc.'s (APDN) past financials and baseline forecasts.
- DCF and Levered DCF Models: Detailed templates to calculate Applied DNA Sciences, Inc.'s (APDN) intrinsic value.
- WACC Sheet: Pre-built calculations for Weighted Average Cost of Capital.
- Editable Inputs: Modify key drivers like growth rates, EBITDA %, and CAPEX assumptions.
- Quarterly and Annual Statements: A complete breakdown of Applied DNA Sciences, Inc.'s (APDN) financials.
- Interactive Dashboard: Visualize valuation results and projections dynamically.
Disclaimer
All information, articles, and product details provided on this website are for general informational and educational purposes only. We do not claim any ownership over, nor do we intend to infringe upon, any trademarks, copyrights, logos, brand names, or other intellectual property mentioned or depicted on this site. Such intellectual property remains the property of its respective owners, and any references here are made solely for identification or informational purposes, without implying any affiliation, endorsement, or partnership.
We make no representations or warranties, express or implied, regarding the accuracy, completeness, or suitability of any content or products presented. Nothing on this website should be construed as legal, tax, investment, financial, medical, or other professional advice. In addition, no part of this site—including articles or product references—constitutes a solicitation, recommendation, endorsement, advertisement, or offer to buy or sell any securities, franchises, or other financial instruments, particularly in jurisdictions where such activity would be unlawful.
All content is of a general nature and may not address the specific circumstances of any individual or entity. It is not a substitute for professional advice or services. Any actions you take based on the information provided here are strictly at your own risk. You accept full responsibility for any decisions or outcomes arising from your use of this website and agree to release us from any liability in connection with your use of, or reliance upon, the content or products found herein.