
|
APL Apollo Tubes Limited (Aplapollo.NS) DCF -Bewertung |
Fully Editable: Tailor To Your Needs In Excel Or Sheets
Professional Design: Trusted, Industry-Standard Templates
Investor-Approved Valuation Models
MAC/PC Compatible, Fully Unlocked
No Expertise Is Needed; Easy To Follow
APL Apollo Tubes Limited (APLAPOLLO.NS) Bundle
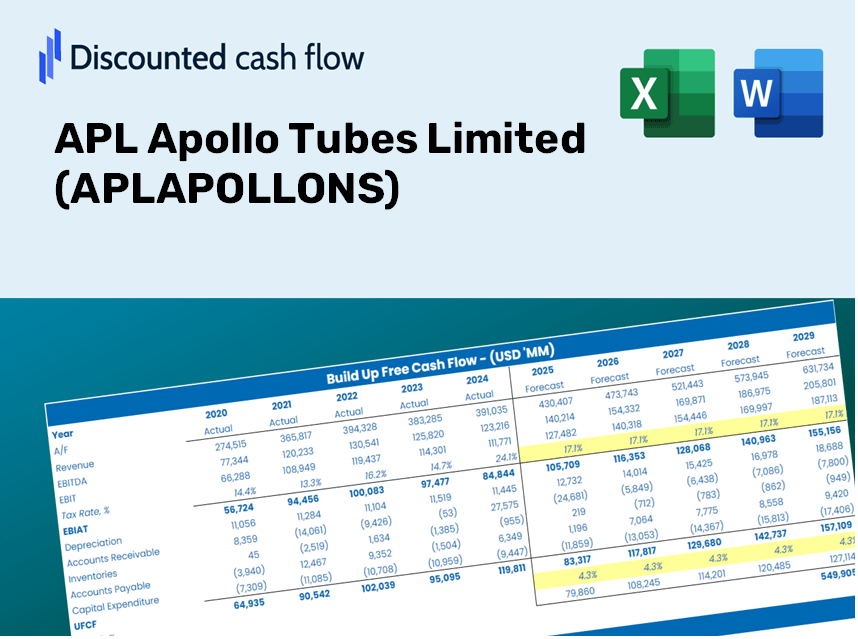
Unabhängig davon, ob Sie ein Investor oder Analyst sind, ist dieser (Aplapollons) DCF-Taschenrechner Ihr Anlaufwerk für eine genaue Bewertung. Mit realen Daten aus APL -Apollo -Röhren begrenzt, können Sie Prognosen anpassen und die Effekte in Echtzeit beobachten.
Discounted Cash Flow (DCF) - (USD MM)
| Year | AY1 2021 |
AY2 2022 |
AY3 2023 |
AY4 2024 |
AY5 2025 |
FY1 2026 |
FY2 2027 |
FY3 2028 |
FY4 2029 |
FY5 2030 |
|---|---|---|---|---|---|---|---|---|---|---|
| Revenue | 82,149.0 | 126,252.7 | 156,743.5 | 180,682.2 | 199,962.9 | 251,844.1 | 317,186.1 | 399,481.3 | 503,128.4 | 633,667.1 |
| Revenue Growth, % | 0 | 53.69 | 24.15 | 15.27 | 10.67 | 25.95 | 25.95 | 25.95 | 25.95 | 25.95 |
| EBITDA | 7,075.2 | 9,799.0 | 10,624.2 | 12,670.3 | 12,950.4 | 18,455.6 | 23,244.0 | 29,274.8 | 36,870.3 | 46,436.4 |
| EBITDA, % | 8.61 | 7.76 | 6.78 | 7.01 | 6.48 | 7.33 | 7.33 | 7.33 | 7.33 | 7.33 |
| Depreciation | 1,027.7 | 1,089.7 | 1,383.3 | 1,759.3 | 2,013.2 | 2,506.9 | 3,157.4 | 3,976.5 | 5,008.3 | 6,307.7 |
| Depreciation, % | 1.25 | 0.86311 | 0.88252 | 0.9737 | 1.01 | 0.99543 | 0.99543 | 0.99543 | 0.99543 | 0.99543 |
| EBIT | 6,047.5 | 8,709.3 | 9,240.9 | 10,911.0 | 10,937.2 | 15,948.7 | 20,086.7 | 25,298.3 | 31,862.0 | 40,128.7 |
| EBIT, % | 7.36 | 6.9 | 5.9 | 6.04 | 5.47 | 6.33 | 6.33 | 6.33 | 6.33 | 6.33 |
| Total Cash | 161.2 | 1,687.3 | 5,003.3 | 11,406.1 | 9,468.3 | 7,944.4 | 10,005.7 | 12,601.7 | 15,871.2 | 19,989.1 |
| Total Cash, percent | .0 | .0 | .0 | .0 | .0 | .0 | .0 | .0 | .0 | .0 |
| Account Receivables | 1,396.9 | 3,516.8 | 1,594.4 | 1,857.4 | 2,716.4 | 3,973.9 | 5,005.0 | 6,303.5 | 7,939.0 | 9,998.8 |
| Account Receivables, % | 1.7 | 2.79 | 1.02 | 1.03 | 1.36 | 1.58 | 1.58 | 1.58 | 1.58 | 1.58 |
| Inventories | 7,599.2 | 8,472.2 | 14,798.7 | 16,379.3 | 16,231.6 | 21,449.5 | 27,014.7 | 34,023.8 | 42,851.4 | 53,969.3 |
| Inventories, % | 9.25 | 6.71 | 9.44 | 9.07 | 8.12 | 8.52 | 8.52 | 8.52 | 8.52 | 8.52 |
| Accounts Payable | 7,858.5 | 10,594.5 | 15,970.0 | 19,816.3 | 22,312.2 | 25,321.4 | 31,891.1 | 40,165.4 | 50,586.5 | 63,711.3 |
| Accounts Payable, % | 9.57 | 8.39 | 10.19 | 10.97 | 11.16 | 10.05 | 10.05 | 10.05 | 10.05 | 10.05 |
| Capital Expenditure | -2,869.2 | -5,966.5 | -8,620.5 | -6,948.4 | -7,225.0 | -10,666.6 | -13,434.2 | -16,919.7 | -21,309.6 | -26,838.4 |
| Capital Expenditure, % | -3.49 | -4.73 | -5.5 | -3.85 | -3.61 | -4.24 | -4.24 | -4.24 | -4.24 | -4.24 |
| Tax Rate, % | 21.18 | 21.18 | 21.18 | 21.18 | 21.18 | 21.18 | 21.18 | 21.18 | 21.18 | 21.18 |
| EBITAT | 3,990.7 | 6,476.9 | 6,870.5 | 8,173.8 | 8,621.2 | 11,752.4 | 14,801.6 | 18,641.9 | 23,478.6 | 29,570.3 |
| Depreciation | ||||||||||
| Changes in Account Receivables | ||||||||||
| Changes in Inventories | ||||||||||
| Changes in Accounts Payable | ||||||||||
| Capital Expenditure | ||||||||||
| UFCF | 1,011.6 | 1,343.2 | 604.7 | 4,987.4 | 5,194.0 | 126.4 | 4,498.3 | 5,665.4 | 7,135.3 | 8,986.6 |
| WACC, % | 5.17 | 5.19 | 5.19 | 5.19 | 5.2 | 5.19 | 5.19 | 5.19 | 5.19 | 5.19 |
| PV UFCF | ||||||||||
| SUM PV UFCF | 21,859.5 | |||||||||
| Long Term Growth Rate, % | 4.00 | |||||||||
| Free cash flow (T + 1) | 9,346 | |||||||||
| Terminal Value | 785,863 | |||||||||
| Present Terminal Value | 610,224 | |||||||||
| Enterprise Value | 632,084 | |||||||||
| Net Debt | 2,656 | |||||||||
| Equity Value | 629,427 | |||||||||
| Diluted Shares Outstanding, MM | 277 | |||||||||
| Equity Value Per Share | 2,269.06 |
What You Will Receive
- Customizable Excel Template: A tailored Excel-based DCF Calculator featuring pre-loaded financial data for APL Apollo Tubes Limited (APLAPOLLONS).
- Accurate Data: Access to historical performance metrics and forward-looking projections (displayed in the highlighted cells).
- Adjustable Forecasts: Modify key assumptions such as revenue growth, EBITDA %, and WACC as needed.
- Instant Calculations: Quickly observe how your adjustments affect the valuation of APL Apollo Tubes Limited (APLAPOLLONS).
- Professional Resource: Designed for investors, CFOs, consultants, and financial analysts alike.
- Intuitive Interface: Organized for straightforward navigation and easy comprehension, complete with step-by-step guidance.
Key Features
- Customizable Financial Inputs: Adjust essential metrics like sales growth, profit margins, and investment spending.
- Instant DCF Valuation: Quickly determines intrinsic value, NPV, and additional financial metrics.
- High-Precision Results: Incorporates APL Apollo Tubes Limited's real financial data for more accurate valuation insights.
- Effortless Scenario Analysis: Easily explore various assumptions and assess their impacts side-by-side.
- Efficiency Booster: Avoid the hassle of constructing extensive valuation models from the ground up.
How It Operates
- Download the Template: Gain immediate access to the Excel-based APL Apollo Tubes Limited (APLAPOLLONS) DCF Calculator.
- Input Your Assumptions: Modify the yellow-highlighted cells to reflect growth rates, WACC, margins, and other variables.
- Instant Calculations: The model automatically recalculates the intrinsic value of APL Apollo Tubes Limited (APLAPOLLONS).
- Test Scenarios: Explore various assumptions to assess potential changes in valuation.
- Analyze and Decide: Utilize the results to inform your investment or financial strategies.
Why Opt for APL Apollo Tubes Limited (APLAPOLLONS) Calculator?
- All-in-One Solution: Integrates DCF, WACC, and financial ratio analyses for comprehensive assessments.
- Flexible Parameters: Customize yellow-highlighted fields to explore different scenarios.
- In-Depth Analysis: Automatically computes APL Apollo's intrinsic value and Net Present Value.
- Ready-to-Use Data: Features historical and projected data for reliable analysis.
- Professional Grade: Perfect for financial analysts, investors, and business consultants.
Who Should Use APL Apollo Tubes Limited (APLAPOLLONS)?
- Finance Students: Acquire essential skills in valuation methods and practice with real-world data.
- Academics: Utilize professional valuation models in your research or teaching materials.
- Investors: Challenge your assumptions and evaluate the valuation metrics for APL Apollo Tubes Limited (APLAPOLLONS).
- Analysts: Enhance your analysis process with a customizable DCF model tailored for APL Apollo Tubes Limited (APLAPOLLONS).
- Small Business Owners: Understand the valuation approaches applied to major public companies like APL Apollo Tubes Limited (APLAPOLLONS).
Contents of the Template
- Pre-Filled Data: Features APL Apollo Tubes Limited's historical financial performance and projections.
- Discounted Cash Flow Model: An editable DCF valuation model with automatic computation capabilities.
- Weighted Average Cost of Capital (WACC): A specialized sheet for WACC calculation based on user-defined inputs.
- Key Financial Ratios: Evaluate APL Apollo Tubes Limited's profitability, operational efficiency, and financial leverage.
- Customizable Inputs: Easily modify assumptions for revenue growth, profit margins, and tax rates.
- Clear Dashboard: Visual representations and tables summarizing essential valuation outcomes.
Disclaimer
All information, articles, and product details provided on this website are for general informational and educational purposes only. We do not claim any ownership over, nor do we intend to infringe upon, any trademarks, copyrights, logos, brand names, or other intellectual property mentioned or depicted on this site. Such intellectual property remains the property of its respective owners, and any references here are made solely for identification or informational purposes, without implying any affiliation, endorsement, or partnership.
We make no representations or warranties, express or implied, regarding the accuracy, completeness, or suitability of any content or products presented. Nothing on this website should be construed as legal, tax, investment, financial, medical, or other professional advice. In addition, no part of this site—including articles or product references—constitutes a solicitation, recommendation, endorsement, advertisement, or offer to buy or sell any securities, franchises, or other financial instruments, particularly in jurisdictions where such activity would be unlawful.
All content is of a general nature and may not address the specific circumstances of any individual or entity. It is not a substitute for professional advice or services. Any actions you take based on the information provided here are strictly at your own risk. You accept full responsibility for any decisions or outcomes arising from your use of this website and agree to release us from any liability in connection with your use of, or reliance upon, the content or products found herein.