
|
Apple Hospitality Reit, Inc. (APLE) DCF -Bewertung |
Fully Editable: Tailor To Your Needs In Excel Or Sheets
Professional Design: Trusted, Industry-Standard Templates
Investor-Approved Valuation Models
MAC/PC Compatible, Fully Unlocked
No Expertise Is Needed; Easy To Follow
Apple Hospitality REIT, Inc. (APLE) Bundle
Vereinfachen Sie die Bewertung von Apple Hospitality REIT, Inc. (APLE) mit diesem anpassbaren DCF -Taschenrechner! Mit Real Apple Hospitality REIT, Inc. (APLE) Finanzdaten und einstellbaren Prognoseeingaben können Sie Szenarien testen und Apple Hospitality REIT, Inc. (APLE) in Minuten aufdecken.
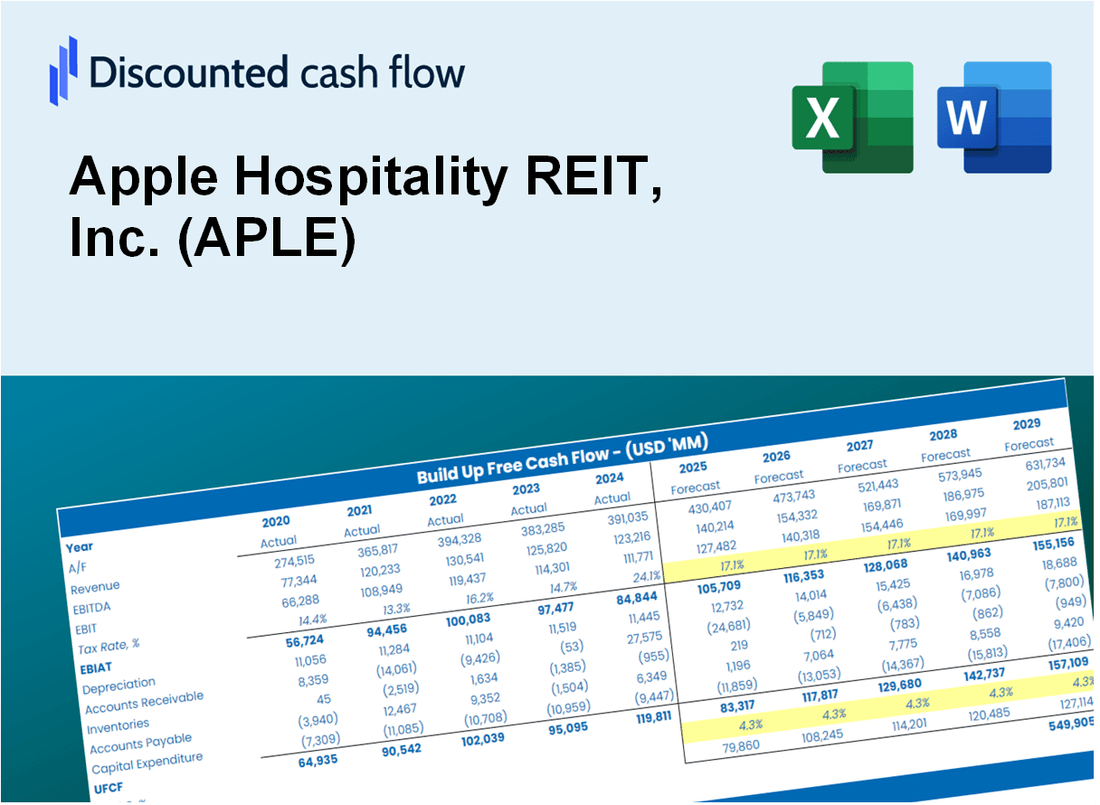
Discounted Cash Flow (DCF) - (USD MM)
| Year | AY1 2020 |
AY2 2021 |
AY3 2022 |
AY4 2023 |
AY5 2024 |
FY1 2025 |
FY2 2026 |
FY3 2027 |
FY4 2028 |
FY5 2029 |
|---|---|---|---|---|---|---|---|---|---|---|
| Revenue | 601.9 | 933.9 | 1,238.4 | 1,343.8 | 1,431.5 | 1,799.4 | 2,261.8 | 2,843.1 | 3,573.8 | 4,492.4 |
| Revenue Growth, % | 0 | 55.16 | 32.61 | 8.51 | 6.52 | 25.7 | 25.7 | 25.7 | 25.7 | 25.7 |
| EBITDA | 97.7 | 271.5 | 388.2 | 430.7 | 483.4 | 512.7 | 644.5 | 810.2 | 1,018.4 | 1,280.1 |
| EBITDA, % | 16.24 | 29.07 | 31.34 | 32.05 | 33.77 | 28.5 | 28.5 | 28.5 | 28.5 | 28.5 |
| Depreciation | 199.8 | 184.5 | 181.7 | 183.2 | 190.6 | 340.3 | 427.8 | 537.8 | 676.0 | 849.7 |
| Depreciation, % | 33.19 | 19.75 | 14.67 | 13.64 | 13.32 | 18.91 | 18.91 | 18.91 | 18.91 | 18.91 |
| EBIT | -102.0 | 87.0 | 206.5 | 247.5 | 292.8 | 172.4 | 216.7 | 272.4 | 342.4 | 430.4 |
| EBIT, % | -16.95 | 9.32 | 16.67 | 18.42 | 20.45 | 9.58 | 9.58 | 9.58 | 9.58 | 9.58 |
| Total Cash | 5.6 | 3.3 | 4.1 | 10.3 | 10.3 | 11.1 | 14.0 | 17.5 | 22.1 | 27.7 |
| Total Cash, percent | .0 | .0 | .0 | .0 | .0 | .0 | .0 | .0 | .0 | .0 |
| Account Receivables | 22.1 | 40.1 | 43.3 | 36.4 | 34.5 | 59.7 | 75.0 | 94.3 | 118.6 | 149.0 |
| Account Receivables, % | 3.68 | 4.29 | 3.5 | 2.71 | 2.41 | 3.32 | 3.32 | 3.32 | 3.32 | 3.32 |
| Inventories | .0 | .0 | .0 | .0 | .0 | .0 | .0 | .0 | .0 | .0 |
| Inventories, % | 0 | 0 | 0 | 0 | 0 | 0 | 0 | 0 | 0 | 0 |
| Accounts Payable | 97.9 | 92.7 | 116.1 | 129.9 | 121.0 | 193.2 | 242.8 | 305.2 | 383.7 | 482.3 |
| Accounts Payable, % | 16.26 | 9.92 | 9.37 | 9.67 | 8.45 | 10.74 | 10.74 | 10.74 | 10.74 | 10.74 |
| Capital Expenditure | -48.6 | -18.3 | -59.4 | -72.1 | -80.3 | -92.8 | -116.7 | -146.7 | -184.4 | -231.8 |
| Capital Expenditure, % | -8.07 | -1.96 | -4.79 | -5.36 | -5.61 | -5.16 | -5.16 | -5.16 | -5.16 | -5.16 |
| Tax Rate, % | 0.44044 | 0.44044 | 0.44044 | 0.44044 | 0.44044 | 0.44044 | 0.44044 | 0.44044 | 0.44044 | 0.44044 |
| EBITAT | -102.2 | 84.9 | 203.7 | 245.9 | 291.5 | 170.7 | 214.6 | 269.8 | 339.1 | 426.3 |
| Depreciation | ||||||||||
| Changes in Account Receivables | ||||||||||
| Changes in Inventories | ||||||||||
| Changes in Accounts Payable | ||||||||||
| Capital Expenditure | ||||||||||
| UFCF | 124.7 | 228.0 | 346.2 | 377.8 | 394.7 | 465.2 | 560.0 | 704.0 | 884.9 | 1,112.3 |
| WACC, % | 6.72 | 6.68 | 6.7 | 6.71 | 6.71 | 6.7 | 6.7 | 6.7 | 6.7 | 6.7 |
| PV UFCF | ||||||||||
| SUM PV UFCF | 2,994.3 | |||||||||
| Long Term Growth Rate, % | 3.00 | |||||||||
| Free cash flow (T + 1) | 1,146 | |||||||||
| Terminal Value | 30,953 | |||||||||
| Present Terminal Value | 22,379 | |||||||||
| Enterprise Value | 25,374 | |||||||||
| Net Debt | 1,573 | |||||||||
| Equity Value | 23,801 | |||||||||
| Diluted Shares Outstanding, MM | 241 | |||||||||
| Equity Value Per Share | 98.65 |
What You Will Receive
- Pre-Filled Financial Model: Apple Hospitality REIT’s actual data allows for accurate DCF valuation.
- Complete Forecast Control: Modify revenue growth, margins, WACC, and other essential drivers.
- Instant Calculations: Automatic updates provide real-time results as you make adjustments.
- Investor-Ready Template: A polished Excel file crafted for professional-level valuation.
- Customizable and Reusable: Designed for flexibility, facilitating repeated use for in-depth forecasts.
Key Features
- 🔍 Real-Life APLE Financials: Pre-filled historical and projected data for Apple Hospitality REIT, Inc. (APLE).
- ✏️ Fully Customizable Inputs: Adjust all critical parameters (yellow cells) such as WACC, growth %, and tax rates.
- 📊 Professional DCF Valuation: Built-in formulas calculate the intrinsic value of Apple Hospitality REIT, Inc. (APLE) using the Discounted Cash Flow method.
- ⚡ Instant Results: Visualize the valuation of Apple Hospitality REIT, Inc. (APLE) instantly after making changes.
- Scenario Analysis: Test and compare outcomes for various financial assumptions side-by-side.
How It Works
- Step 1: Download the prebuilt Excel template featuring Apple Hospitality REIT, Inc. (APLE) data.
- Step 2: Navigate through the pre-filled sheets to familiarize yourself with the essential metrics.
- Step 3: Modify forecasts and assumptions in the editable yellow cells (WACC, growth, margins).
- Step 4: Instantly view updated results, including the intrinsic value of Apple Hospitality REIT, Inc. (APLE).
- Step 5: Make well-informed investment decisions or create reports based on the generated outputs.
Why Choose This Calculator?
- Comprehensive Tool: Features DCF, WACC, and financial ratio analyses all in one solution.
- Customizable Inputs: Modify yellow-highlighted cells to explore different investment scenarios.
- Detailed Insights: Automatically computes Apple Hospitality REIT’s intrinsic value and Net Present Value.
- Preloaded Data: Access to historical and projected data for precise analysis.
- Professional Quality: Perfect for financial analysts, investors, and real estate consultants.
Who Should Use This Product?
- Investors: Accurately assess Apple Hospitality REIT, Inc.'s (APLE) fair value prior to making investment choices.
- CFOs: Utilize a professional-grade DCF model for comprehensive financial reporting and analysis.
- Consultants: Efficiently customize the template for valuation reports tailored to clients.
- Entrepreneurs: Acquire insights into financial modeling practices employed by leading real estate investment trusts.
- Educators: Implement it as a teaching resource to illustrate valuation techniques and methodologies.
What the Template Contains
- Pre-Filled Data: Includes Apple Hospitality REIT, Inc.'s historical financials and forecasts.
- Discounted Cash Flow Model: Editable DCF valuation model with automatic calculations tailored for Apple Hospitality REIT, Inc. (APLE).
- Weighted Average Cost of Capital (WACC): A dedicated sheet for calculating WACC based on custom inputs specific to Apple Hospitality REIT, Inc. (APLE).
- Key Financial Ratios: Analyze Apple Hospitality REIT, Inc.'s profitability, efficiency, and leverage.
- Customizable Inputs: Edit revenue growth, margins, and tax rates with ease for Apple Hospitality REIT, Inc. (APLE).
- Clear Dashboard: Charts and tables summarizing key valuation results for Apple Hospitality REIT, Inc. (APLE).
Disclaimer
All information, articles, and product details provided on this website are for general informational and educational purposes only. We do not claim any ownership over, nor do we intend to infringe upon, any trademarks, copyrights, logos, brand names, or other intellectual property mentioned or depicted on this site. Such intellectual property remains the property of its respective owners, and any references here are made solely for identification or informational purposes, without implying any affiliation, endorsement, or partnership.
We make no representations or warranties, express or implied, regarding the accuracy, completeness, or suitability of any content or products presented. Nothing on this website should be construed as legal, tax, investment, financial, medical, or other professional advice. In addition, no part of this site—including articles or product references—constitutes a solicitation, recommendation, endorsement, advertisement, or offer to buy or sell any securities, franchises, or other financial instruments, particularly in jurisdictions where such activity would be unlawful.
All content is of a general nature and may not address the specific circumstances of any individual or entity. It is not a substitute for professional advice or services. Any actions you take based on the information provided here are strictly at your own risk. You accept full responsibility for any decisions or outcomes arising from your use of this website and agree to release us from any liability in connection with your use of, or reliance upon, the content or products found herein.