
|
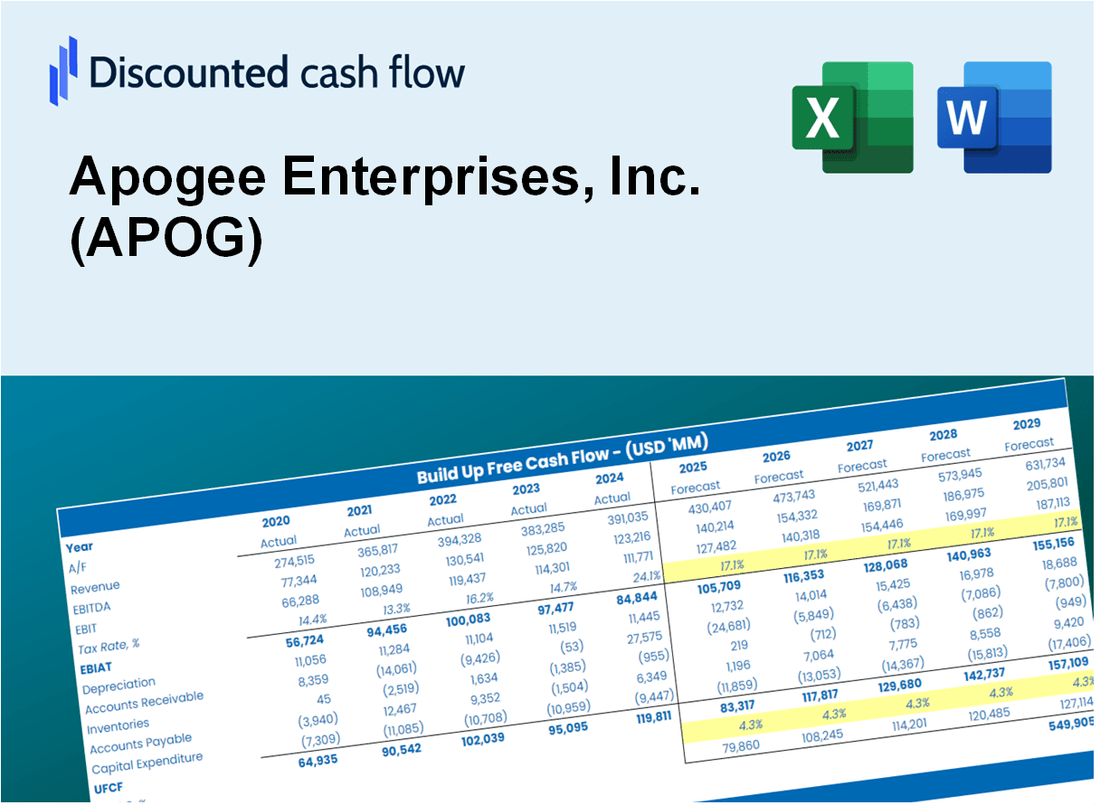
Apogee Enterprises, Inc. (APOG) DCF -Bewertung |
Fully Editable: Tailor To Your Needs In Excel Or Sheets
Professional Design: Trusted, Industry-Standard Templates
Investor-Approved Valuation Models
MAC/PC Compatible, Fully Unlocked
No Expertise Is Needed; Easy To Follow
Apogee Enterprises, Inc. (APOG) Bundle
Möchten Sie den inneren Wert von Apogee Enterprises, Inc. beurteilen? Unser (APOG) DCF-Taschenrechner integriert reale Daten mit umfangreichen Anpassungsfunktionen, sodass Sie Ihre Prognosen verfeinern und Ihre Anlagestrategien verbessern können.
Discounted Cash Flow (DCF) - (USD MM)
| Year | AY1 2021 |
AY2 2022 |
AY3 2023 |
AY4 2024 |
AY5 2025 |
FY1 2026 |
FY2 2027 |
FY3 2028 |
FY4 2029 |
FY5 2030 |
|---|---|---|---|---|---|---|---|---|---|---|
| Revenue | 1,230.8 | 1,314.0 | 1,440.7 | 1,416.9 | 1,361.0 | 1,397.8 | 1,435.5 | 1,474.3 | 1,514.1 | 1,555.1 |
| Revenue Growth, % | 0 | 6.76 | 9.64 | -1.65 | -3.95 | 2.7 | 2.7 | 2.7 | 2.7 | 2.7 |
| EBITDA | 139.6 | 152.0 | 168.2 | 187.8 | 184.9 | 171.7 | 176.4 | 181.1 | 186.0 | 191.1 |
| EBITDA, % | 11.35 | 11.57 | 11.67 | 13.26 | 13.59 | 12.29 | 12.29 | 12.29 | 12.29 | 12.29 |
| Depreciation | 51.4 | 50.0 | 42.4 | 41.6 | 44.6 | 47.9 | 49.2 | 50.5 | 51.9 | 53.3 |
| Depreciation, % | 4.18 | 3.8 | 2.94 | 2.94 | 3.28 | 3.43 | 3.43 | 3.43 | 3.43 | 3.43 |
| EBIT | 88.2 | 102.0 | 125.8 | 146.2 | 140.3 | 123.8 | 127.2 | 130.6 | 134.1 | 137.8 |
| EBIT, % | 7.17 | 7.76 | 8.73 | 10.32 | 10.31 | 8.86 | 8.86 | 8.86 | 8.86 | 8.86 |
| Total Cash | 47.3 | 37.6 | 19.9 | 40.0 | 46.2 | 40.0 | 41.1 | 42.2 | 43.3 | 44.5 |
| Total Cash, percent | .0 | .0 | .0 | .0 | .0 | .0 | .0 | .0 | .0 | .0 |
| Account Receivables | 205.4 | 199.0 | 256.7 | 223.1 | 257.4 | 235.7 | 242.1 | 248.6 | 255.3 | 262.2 |
| Account Receivables, % | 16.69 | 15.14 | 17.82 | 15.74 | 18.91 | 16.86 | 16.86 | 16.86 | 16.86 | 16.86 |
| Inventories | 72.8 | 80.5 | 78.4 | 69.2 | 92.3 | 81.5 | 83.7 | 86.0 | 88.3 | 90.7 |
| Inventories, % | 5.92 | 6.13 | 5.44 | 4.89 | 6.78 | 5.83 | 5.83 | 5.83 | 5.83 | 5.83 |
| Accounts Payable | 76.2 | 92.1 | 86.5 | 84.8 | 98.8 | 90.7 | 93.2 | 95.7 | 98.3 | 100.9 |
| Accounts Payable, % | 6.19 | 7.01 | 6.01 | 5.98 | 7.26 | 6.49 | 6.49 | 6.49 | 6.49 | 6.49 |
| Capital Expenditure | -26.2 | -21.8 | -45.2 | -43.2 | -35.6 | -35.2 | -36.1 | -37.1 | -38.1 | -39.1 |
| Capital Expenditure, % | -2.13 | -1.66 | -3.14 | -3.05 | -2.62 | -2.52 | -2.52 | -2.52 | -2.52 | -2.52 |
| Tax Rate, % | 24.45 | 24.45 | 24.45 | 24.45 | 24.45 | 24.45 | 24.45 | 24.45 | 24.45 | 24.45 |
| EBITAT | 60.2 | 25.6 | 112.3 | 112.7 | 106.0 | 83.0 | 85.3 | 87.6 | 89.9 | 92.4 |
| Depreciation | ||||||||||
| Changes in Account Receivables | ||||||||||
| Changes in Inventories | ||||||||||
| Changes in Accounts Payable | ||||||||||
| Capital Expenditure | ||||||||||
| UFCF | -116.5 | 68.4 | 48.3 | 152.1 | 71.6 | 120.2 | 92.2 | 94.7 | 97.3 | 99.9 |
| WACC, % | 6.88 | 6.36 | 7.14 | 6.99 | 6.97 | 6.87 | 6.87 | 6.87 | 6.87 | 6.87 |
| PV UFCF | ||||||||||
| SUM PV UFCF | 417.1 | |||||||||
| Long Term Growth Rate, % | 3.50 | |||||||||
| Free cash flow (T + 1) | 103 | |||||||||
| Terminal Value | 3,070 | |||||||||
| Present Terminal Value | 2,203 | |||||||||
| Enterprise Value | 2,620 | |||||||||
| Net Debt | 310 | |||||||||
| Equity Value | 2,309 | |||||||||
| Diluted Shares Outstanding, MM | 22 | |||||||||
| Equity Value Per Share | 105.49 |
What You Will Get
- Real APOG Financial Data: Pre-filled with Apogee Enterprises’ historical and projected data for precise analysis.
- Fully Editable Template: Modify key inputs like revenue growth, WACC, and EBITDA % with ease.
- Automatic Calculations: See Apogee Enterprises’ intrinsic value update instantly based on your changes.
- Professional Valuation Tool: Designed for investors, analysts, and consultants seeking accurate DCF results.
- User-Friendly Design: Simple structure and clear instructions for all experience levels.
Key Features
- Comprehensive Financial Data: Apogee Enterprises' historical financial statements and pre-filled projections.
- Customizable Parameters: Modify WACC, tax rates, revenue growth, and EBITDA margins as needed.
- Real-Time Valuation: Observe Apogee's intrinsic value recalculating instantly.
- Intuitive Visual Displays: Dashboard graphs illustrate valuation outcomes and essential metrics.
- Designed for Precision: A reliable tool for analysts, investors, and finance professionals.
How It Works
- Download: Obtain the comprehensive Excel file featuring Apogee Enterprises, Inc. (APOG) financial data.
- Customize: Modify projections, including revenue growth, EBITDA %, and WACC.
- Update Automatically: The intrinsic value and NPV calculations refresh in real-time.
- Test Scenarios: Develop various forecasts and instantly compare results.
- Make Decisions: Leverage the valuation findings to inform your investment strategy.
Why Choose This Calculator for Apogee Enterprises, Inc. (APOG)?
- Accurate Data: Utilize real Apogee financials for trustworthy valuation outcomes.
- Customizable: Modify essential parameters such as growth rates, WACC, and tax rates to align with your forecasts.
- Time-Saving: Pre-configured calculations save you the hassle of starting from the ground up.
- Professional-Grade Tool: Tailored for investors, analysts, and consultants in the field.
- User-Friendly: An intuitive design and clear instructions ensure ease of use for all experience levels.
Who Should Use Apogee Enterprises, Inc. (APOG)?
- Investors: Make informed investment choices with insights from a leading provider in the architectural glass and services industry.
- Financial Analysts: Streamline your analysis with comprehensive financial data and performance metrics tailored for customization.
- Consultants: Efficiently modify reports and presentations to showcase Apogee's market position and growth potential.
- Industry Enthusiasts: Enhance your knowledge of architectural solutions and market trends through detailed case studies.
- Educators and Students: Utilize it as a resource for understanding business strategies in construction and manufacturing sectors.
What the Template Contains
- Pre-Filled Data: Contains Apogee Enterprises' historical financials and future projections.
- Discounted Cash Flow Model: Editable DCF valuation model featuring automatic calculations.
- Weighted Average Cost of Capital (WACC): A dedicated sheet for WACC calculation based on user-defined inputs.
- Key Financial Ratios: Evaluate Apogee's profitability, efficiency, and financial leverage.
- Customizable Inputs: Easily modify revenue growth, profit margins, and tax rates.
- Clear Dashboard: Visual representations and tables summarizing essential valuation outcomes.
Disclaimer
All information, articles, and product details provided on this website are for general informational and educational purposes only. We do not claim any ownership over, nor do we intend to infringe upon, any trademarks, copyrights, logos, brand names, or other intellectual property mentioned or depicted on this site. Such intellectual property remains the property of its respective owners, and any references here are made solely for identification or informational purposes, without implying any affiliation, endorsement, or partnership.
We make no representations or warranties, express or implied, regarding the accuracy, completeness, or suitability of any content or products presented. Nothing on this website should be construed as legal, tax, investment, financial, medical, or other professional advice. In addition, no part of this site—including articles or product references—constitutes a solicitation, recommendation, endorsement, advertisement, or offer to buy or sell any securities, franchises, or other financial instruments, particularly in jurisdictions where such activity would be unlawful.
All content is of a general nature and may not address the specific circumstances of any individual or entity. It is not a substitute for professional advice or services. Any actions you take based on the information provided here are strictly at your own risk. You accept full responsibility for any decisions or outcomes arising from your use of this website and agree to release us from any liability in connection with your use of, or reliance upon, the content or products found herein.