
|
Aptiv plc (APTV) DCF -Bewertung |
Fully Editable: Tailor To Your Needs In Excel Or Sheets
Professional Design: Trusted, Industry-Standard Templates
Investor-Approved Valuation Models
MAC/PC Compatible, Fully Unlocked
No Expertise Is Needed; Easy To Follow
Aptiv PLC (APTV) Bundle
Unabhängig davon, ob Sie Investor oder Analyst sind, dient dieser (APTV) DCF -Taschenrechner als wesentliche Ressource für eine genaue Bewertung. Mit echten Daten von Aptiv plc.
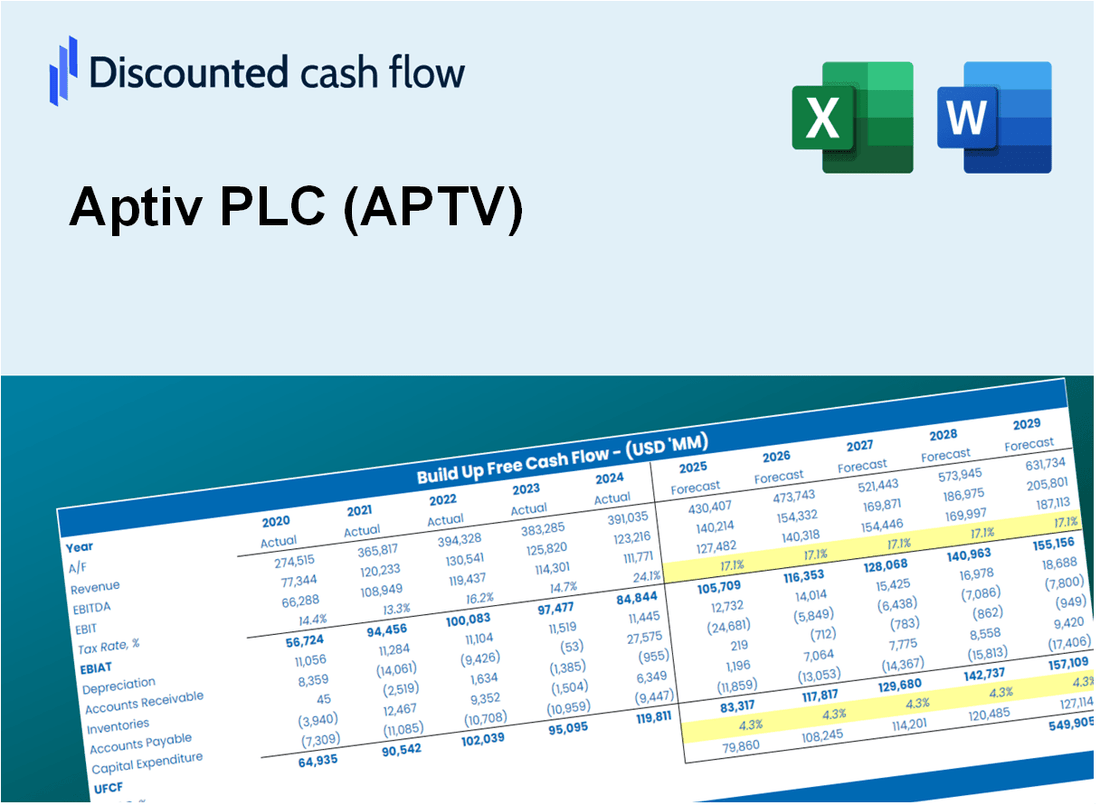
Discounted Cash Flow (DCF) - (USD MM)
| Year | AY1 2020 |
AY2 2021 |
AY3 2022 |
AY4 2023 |
AY5 2024 |
FY1 2025 |
FY2 2026 |
FY3 2027 |
FY4 2028 |
FY5 2029 |
|---|---|---|---|---|---|---|---|---|---|---|
| Revenue | 13,066.0 | 15,618.0 | 17,489.0 | 20,051.0 | 19,713.0 | 21,904.8 | 24,340.4 | 27,046.7 | 30,054.0 | 33,395.6 |
| Revenue Growth, % | 0 | 19.53 | 11.98 | 14.65 | -1.69 | 11.12 | 11.12 | 11.12 | 11.12 | 11.12 |
| EBITDA | 2,882.0 | 1,833.0 | 1,971.0 | 2,534.0 | 3,452.0 | 3,295.0 | 3,661.4 | 4,068.5 | 4,520.9 | 5,023.5 |
| EBITDA, % | 22.06 | 11.74 | 11.27 | 12.64 | 17.51 | 15.04 | 15.04 | 15.04 | 15.04 | 15.04 |
| Depreciation | 764.0 | 773.0 | 762.0 | 912.0 | 964.0 | 1,077.4 | 1,197.2 | 1,330.3 | 1,478.2 | 1,642.5 |
| Depreciation, % | 5.85 | 4.95 | 4.36 | 4.55 | 4.89 | 4.92 | 4.92 | 4.92 | 4.92 | 4.92 |
| EBIT | 2,118.0 | 1,060.0 | 1,209.0 | 1,622.0 | 2,488.0 | 2,217.7 | 2,464.2 | 2,738.2 | 3,042.7 | 3,381.0 |
| EBIT, % | 16.21 | 6.79 | 6.91 | 8.09 | 12.62 | 10.12 | 10.12 | 10.12 | 10.12 | 10.12 |
| Total Cash | 2,821.0 | 3,139.0 | 1,531.0 | 1,640.0 | 1,573.0 | 2,917.8 | 3,242.2 | 3,602.7 | 4,003.3 | 4,448.4 |
| Total Cash, percent | .0 | .0 | .0 | .0 | .0 | .0 | .0 | .0 | .0 | .0 |
| Account Receivables | 3,016.0 | 3,032.0 | 3,672.0 | 3,870.0 | 3,622.0 | 4,432.1 | 4,924.9 | 5,472.5 | 6,080.9 | 6,757.0 |
| Account Receivables, % | 23.08 | 19.41 | 21 | 19.3 | 18.37 | 20.23 | 20.23 | 20.23 | 20.23 | 20.23 |
| Inventories | 1,297.0 | 2,014.0 | 2,340.0 | 2,365.0 | 2,320.0 | 2,618.3 | 2,909.4 | 3,232.9 | 3,592.4 | 3,991.8 |
| Inventories, % | 9.93 | 12.9 | 13.38 | 11.79 | 11.77 | 11.95 | 11.95 | 11.95 | 11.95 | 11.95 |
| Accounts Payable | 2,571.0 | 2,953.0 | 3,150.0 | 3,151.0 | 2,870.0 | 3,805.7 | 4,228.9 | 4,699.1 | 5,221.6 | 5,802.1 |
| Accounts Payable, % | 19.68 | 18.91 | 18.01 | 15.71 | 14.56 | 17.37 | 17.37 | 17.37 | 17.37 | 17.37 |
| Capital Expenditure | -584.0 | -611.0 | -844.0 | -906.0 | -830.0 | -961.0 | -1,067.9 | -1,186.6 | -1,318.6 | -1,465.2 |
| Capital Expenditure, % | -4.47 | -3.91 | -4.83 | -4.52 | -4.21 | -4.39 | -4.39 | -4.39 | -4.39 | -4.39 |
| Tax Rate, % | 12.1 | 12.1 | 12.1 | 12.1 | 12.1 | 12.1 | 12.1 | 12.1 | 12.1 | 12.1 |
| EBITAT | 2,042.2 | 880.8 | 1,010.1 | 4,591.0 | 2,186.9 | 2,000.2 | 2,222.6 | 2,469.7 | 2,744.3 | 3,049.4 |
| Depreciation | ||||||||||
| Changes in Account Receivables | ||||||||||
| Changes in Inventories | ||||||||||
| Changes in Accounts Payable | ||||||||||
| Capital Expenditure | ||||||||||
| UFCF | 480.2 | 691.8 | 159.1 | 4,375.0 | 2,332.9 | 1,943.9 | 1,991.1 | 2,212.5 | 2,458.5 | 2,731.8 |
| WACC, % | 8.68 | 8.53 | 8.53 | 8.72 | 8.58 | 8.61 | 8.61 | 8.61 | 8.61 | 8.61 |
| PV UFCF | ||||||||||
| SUM PV UFCF | 8,779.2 | |||||||||
| Long Term Growth Rate, % | 4.00 | |||||||||
| Free cash flow (T + 1) | 2,841 | |||||||||
| Terminal Value | 61,644 | |||||||||
| Present Terminal Value | 40,791 | |||||||||
| Enterprise Value | 49,570 | |||||||||
| Net Debt | 7,315 | |||||||||
| Equity Value | 42,255 | |||||||||
| Diluted Shares Outstanding, MM | 257 | |||||||||
| Equity Value Per Share | 164.63 |
What You Will Receive
- Customizable Excel Template: A fully editable Excel-based DCF Calculator featuring pre-loaded financial data for APTV.
- Real-Time Data: Access to historical performance metrics and forward-looking projections (highlighted in the yellow cells).
- Adjustable Forecasts: Modify key assumptions such as revenue growth, EBITDA %, and WACC as needed.
- Instant Calculations: Quickly observe how your inputs affect Aptiv’s valuation.
- Professional Resource: Designed for investors, CFOs, consultants, and financial analysts.
- Intuitive Layout: Organized for simplicity and user-friendliness, complete with step-by-step guidance.
Key Features
- Comprehensive DCF Calculator: Offers detailed unlevered and levered DCF valuation models tailored for Aptiv PLC (APTV).
- WACC Calculator: Features a pre-built Weighted Average Cost of Capital sheet with adjustable parameters.
- Customizable Forecast Assumptions: Alter growth rates, capital expenditures, and discount rates as needed.
- Integrated Financial Ratios: Evaluate profitability, leverage, and efficiency ratios specific to Aptiv PLC (APTV).
- Interactive Dashboard and Charts: Visual representations that summarize essential valuation metrics for straightforward analysis.
How It Works
- Download the Template: Gain immediate access to the Excel-based APTV DCF Calculator.
- Input Your Assumptions: Modify the yellow-highlighted cells for growth rates, WACC, margins, and additional factors.
- Instant Calculations: The model automatically refreshes Aptiv’s intrinsic value.
- Test Scenarios: Experiment with various assumptions to assess potential valuation shifts.
- Analyze and Decide: Utilize the findings to inform your investment or financial analysis.
Why Choose the Aptiv PLC (APTV) Calculator?
- Save Time: Quickly access a pre-built DCF model without starting from scratch.
- Enhance Accuracy: Utilize dependable financial data and formulas to minimize valuation errors.
- Completely Customizable: Adjust the model to incorporate your unique assumptions and forecasts.
- User-Friendly: Intuitive charts and outputs simplify the analysis of results.
- Endorsed by Professionals: Crafted for experts who prioritize accuracy and functionality.
Who Should Use This Product?
- Finance Students: Master valuation techniques and apply them using real-time data for Aptiv PLC (APTV).
- Academics: Integrate advanced models into your coursework or research related to Aptiv PLC (APTV).
- Investors: Validate your investment strategies and analyze valuation results for Aptiv PLC (APTV).
- Analysts: Enhance your efficiency with a customizable DCF model tailored for Aptiv PLC (APTV).
- Small Business Owners: Understand the analytical methods used for large public companies like Aptiv PLC (APTV).
What the Aptiv Template Contains
- Preloaded APTV Data: Historical and projected financial data, including revenue, EBIT, and capital expenditures.
- DCF and WACC Models: Professional-grade sheets for calculating intrinsic value and Weighted Average Cost of Capital.
- Editable Inputs: Yellow-highlighted cells for adjusting revenue growth, tax rates, and discount rates.
- Financial Statements: Comprehensive annual and quarterly financials for deeper analysis.
- Key Ratios: Profitability, leverage, and efficiency ratios to evaluate performance.
- Dashboard and Charts: Visual summaries of valuation outcomes and assumptions.
Disclaimer
All information, articles, and product details provided on this website are for general informational and educational purposes only. We do not claim any ownership over, nor do we intend to infringe upon, any trademarks, copyrights, logos, brand names, or other intellectual property mentioned or depicted on this site. Such intellectual property remains the property of its respective owners, and any references here are made solely for identification or informational purposes, without implying any affiliation, endorsement, or partnership.
We make no representations or warranties, express or implied, regarding the accuracy, completeness, or suitability of any content or products presented. Nothing on this website should be construed as legal, tax, investment, financial, medical, or other professional advice. In addition, no part of this site—including articles or product references—constitutes a solicitation, recommendation, endorsement, advertisement, or offer to buy or sell any securities, franchises, or other financial instruments, particularly in jurisdictions where such activity would be unlawful.
All content is of a general nature and may not address the specific circumstances of any individual or entity. It is not a substitute for professional advice or services. Any actions you take based on the information provided here are strictly at your own risk. You accept full responsibility for any decisions or outcomes arising from your use of this website and agree to release us from any liability in connection with your use of, or reliance upon, the content or products found herein.