
|
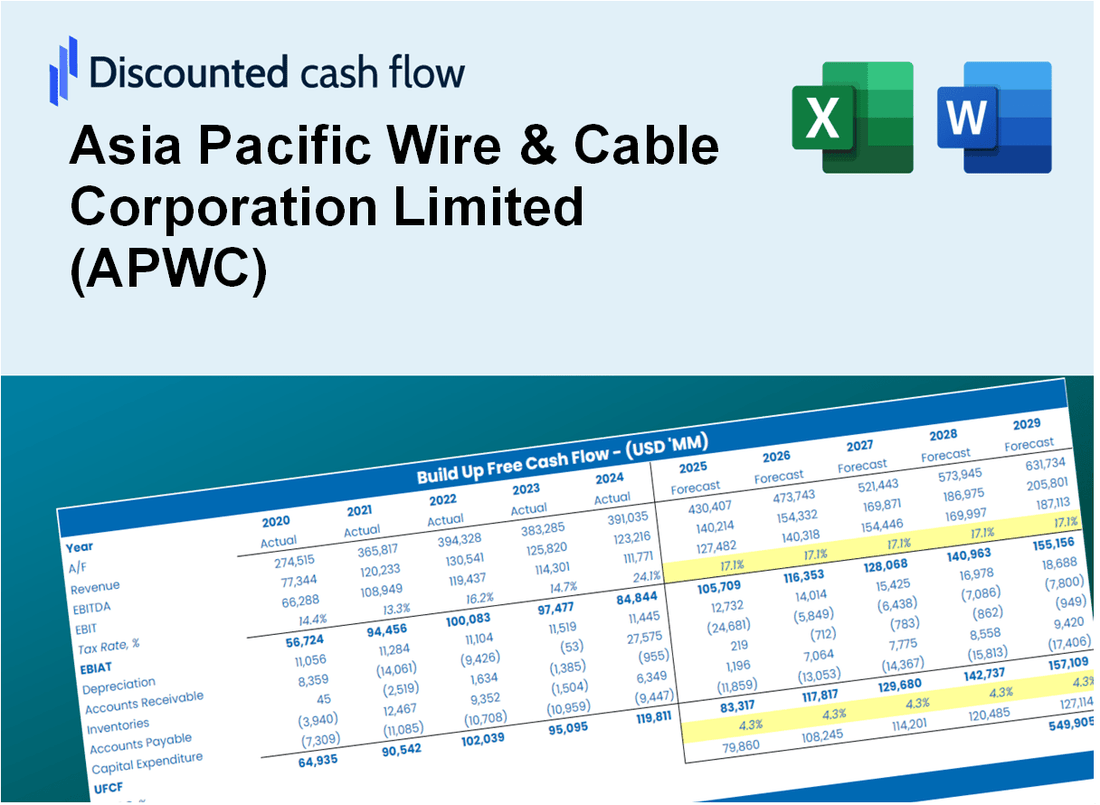
Asien -Pazifikdraht & Cable Corporation Limited (APWC) DCF -Bewertung |
Fully Editable: Tailor To Your Needs In Excel Or Sheets
Professional Design: Trusted, Industry-Standard Templates
Investor-Approved Valuation Models
MAC/PC Compatible, Fully Unlocked
No Expertise Is Needed; Easy To Follow
Asia Pacific Wire & Cable Corporation Limited (APWC) Bundle
Unser (APWC) DCF -Taschenrechner (APWC) für Genauigkeit entwickelt & Cable Corporation Limited unter Verwendung realer Finanzdaten und bietet vollständige Flexibilität, um alle Schlüsselparameter für erweiterte Projektionen zu ändern.
What You Will Receive
- Comprehensive Financial Model: APWC’s actual data facilitates accurate DCF valuation.
- Complete Forecast Control: Modify revenue growth, profit margins, WACC, and other essential factors.
- Real-Time Calculations: Automatic updates provide immediate feedback as you adjust inputs.
- Professional-Grade Template: A polished Excel file crafted for high-quality valuation presentations.
- Flexible and Reusable: Designed for adaptability, enabling repeated application for in-depth forecasts.
Key Features
- Comprehensive DCF Calculator: Features detailed unlevered and levered DCF valuation models tailored for Asia Pacific Wire & Cable Corporation Limited (APWC).
- WACC Calculator: Pre-configured Weighted Average Cost of Capital sheet with adjustable parameters for precise analysis.
- Customizable Forecast Assumptions: Easily alter growth rates, capital expenditures, and discount rates to fit your analysis needs.
- Integrated Financial Ratios: Evaluate profitability, leverage, and efficiency ratios specific to Asia Pacific Wire & Cable Corporation Limited (APWC).
- Interactive Dashboard and Charts: Visual representations that condense key valuation metrics for streamlined analysis.
How It Works
- Download: Obtain the comprehensive Excel file featuring Asia Pacific Wire & Cable Corporation Limited's (APWC) financial data.
- Customize: Tailor your forecasts, including revenue growth, EBITDA %, and WACC to fit your analysis.
- Update Automatically: Enjoy real-time updates for intrinsic value and NPV calculations as you make adjustments.
- Test Scenarios: Generate various projections and instantly compare the results.
- Make Decisions: Leverage the valuation insights to inform your investment choices.
Why Choose This Calculator for Asia Pacific Wire & Cable Corporation Limited (APWC)?
- Accurate Data: Utilize real financials from APWC for dependable valuation outcomes.
- Customizable: Tailor essential parameters such as growth rates, WACC, and tax rates to align with your forecasts.
- Time-Saving: Pre-configured calculations save you the hassle of starting from the beginning.
- Professional-Grade Tool: Created for investors, analysts, and consultants focused on APWC.
- User-Friendly: An intuitive design and clear instructions make it accessible for all users.
Who Should Use This Product?
- Finance Students: Understand the intricacies of cable manufacturing and apply financial models using real-world data.
- Academics: Utilize industry-specific metrics in your research or teaching materials.
- Investors: Evaluate your investment strategies and analyze valuation metrics for Asia Pacific Wire & Cable Corporation Limited (APWC).
- Analysts: Enhance your analysis with a customizable model tailored for the wire and cable sector.
- Small Business Owners: Learn from the operational strategies of public companies like Asia Pacific Wire & Cable Corporation Limited (APWC).
What the Template Contains
- Comprehensive DCF Model: Editable template with detailed valuation calculations tailored for Asia Pacific Wire & Cable Corporation Limited (APWC).
- Real-World Data: APWC’s historical and projected financials preloaded for in-depth analysis.
- Customizable Parameters: Adjust WACC, growth rates, and tax assumptions to explore various scenarios.
- Financial Statements: Complete annual and quarterly breakdowns for enhanced insights into APWC's performance.
- Key Ratios: Integrated analysis for profitability, efficiency, and leverage specific to APWC.
- Dashboard with Visual Outputs: Charts and tables presenting clear, actionable results for stakeholders.
Disclaimer
All information, articles, and product details provided on this website are for general informational and educational purposes only. We do not claim any ownership over, nor do we intend to infringe upon, any trademarks, copyrights, logos, brand names, or other intellectual property mentioned or depicted on this site. Such intellectual property remains the property of its respective owners, and any references here are made solely for identification or informational purposes, without implying any affiliation, endorsement, or partnership.
We make no representations or warranties, express or implied, regarding the accuracy, completeness, or suitability of any content or products presented. Nothing on this website should be construed as legal, tax, investment, financial, medical, or other professional advice. In addition, no part of this site—including articles or product references—constitutes a solicitation, recommendation, endorsement, advertisement, or offer to buy or sell any securities, franchises, or other financial instruments, particularly in jurisdictions where such activity would be unlawful.
All content is of a general nature and may not address the specific circumstances of any individual or entity. It is not a substitute for professional advice or services. Any actions you take based on the information provided here are strictly at your own risk. You accept full responsibility for any decisions or outcomes arising from your use of this website and agree to release us from any liability in connection with your use of, or reliance upon, the content or products found herein.