
|
APYX Medical Corporation (APYX) DCF -Bewertung |
Fully Editable: Tailor To Your Needs In Excel Or Sheets
Professional Design: Trusted, Industry-Standard Templates
Investor-Approved Valuation Models
MAC/PC Compatible, Fully Unlocked
No Expertise Is Needed; Easy To Follow
Apyx Medical Corporation (APYX) Bundle
Bewerten Sie die finanzielle Aussichten der APYX Medical Corporation (APYX) wie ein Experte! Dieser (APYX) DCF-Taschenrechner bietet vorgefüllte Finanzdaten und vollständige Flexibilität, um das Umsatzwachstum, WACC, Margen und andere kritische Annahmen zu ändern, um sich an Ihren Projektionen anzupassen.
What You Will Get
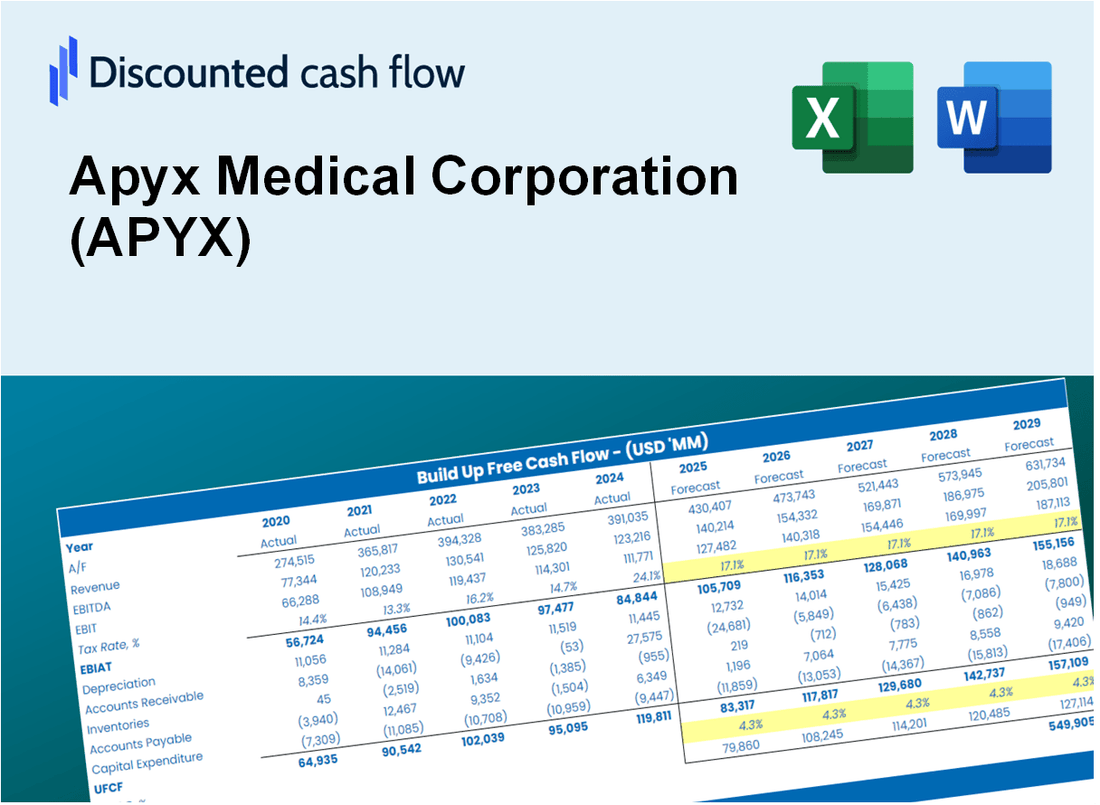
- Real APYX Financial Data: Pre-filled with Apyx Medical’s historical and projected data for precise analysis.
- Fully Editable Template: Modify key inputs like revenue growth, WACC, and EBITDA % with ease.
- Automatic Calculations: See Apyx Medical’s intrinsic value update instantly based on your changes.
- Professional Valuation Tool: Designed for investors, analysts, and consultants seeking accurate DCF results.
- User-Friendly Design: Simple structure and clear instructions for all experience levels.
Key Features
- 🔍 Real-Life APYX Financials: Pre-filled historical and projected data for Apyx Medical Corporation (APYX).
- ✏️ Fully Customizable Inputs: Adjust all critical parameters (yellow cells) such as WACC, growth %, and tax rates.
- 📊 Professional DCF Valuation: Built-in formulas calculate Apyx Medical’s intrinsic value using the Discounted Cash Flow method.
- ⚡ Instant Results: Visualize Apyx Medical’s valuation instantly after making changes.
- Scenario Analysis: Test and compare outcomes for various financial assumptions side-by-side.
How It Works
- 1. Access the Template: Download and open the Excel file featuring Apyx Medical Corporation’s (APYX) preloaded data.
- 2. Modify Assumptions: Adjust key inputs such as growth rates, WACC, and capital expenditures.
- 3. Analyze Results Instantly: The DCF model automatically computes intrinsic value and NPV.
- 4. Explore Scenarios: Evaluate various forecasts to assess different valuation results.
- 5. Present with Assurance: Deliver professional valuation insights to inform your decisions.
Why Choose Apyx Medical Corporation (APYX)?
- Innovative Technology: Cutting-edge solutions in the medical device industry enhance patient care.
- Proven Track Record: A history of successful product launches and satisfied customers.
- Commitment to Quality: Stringent quality control processes ensure reliable and effective products.
- Expert Team: A dedicated team of professionals with extensive industry experience drives our success.
- Strong Market Position: Apyx Medical Corporation (APYX) is recognized for its leadership in advanced surgical technologies.
Who Should Use This Product?
- Medical Students: Understand advanced medical technologies and their applications using real-world data.
- Researchers: Integrate cutting-edge medical models into studies or academic projects.
- Investors: Evaluate your investment hypotheses and assess valuation metrics for Apyx Medical Corporation (APYX).
- Healthcare Analysts: Enhance your analysis with a customizable financial model tailored for the medical sector.
- Healthcare Entrepreneurs: Discover how large medical firms like Apyx Medical Corporation (APYX) are evaluated in the market.
What the Template Contains
- Pre-Filled Data: Contains Apyx Medical Corporation’s historical financials and projections.
- Discounted Cash Flow Model: An editable DCF valuation model with automatic calculations.
- Weighted Average Cost of Capital (WACC): A dedicated sheet for calculating WACC using custom inputs.
- Key Financial Ratios: Evaluate Apyx Medical Corporation’s profitability, efficiency, and leverage.
- Customizable Inputs: Easily modify revenue growth, margins, and tax rates.
- Clear Dashboard: Visuals and tables summarizing key valuation outcomes.
Disclaimer
All information, articles, and product details provided on this website are for general informational and educational purposes only. We do not claim any ownership over, nor do we intend to infringe upon, any trademarks, copyrights, logos, brand names, or other intellectual property mentioned or depicted on this site. Such intellectual property remains the property of its respective owners, and any references here are made solely for identification or informational purposes, without implying any affiliation, endorsement, or partnership.
We make no representations or warranties, express or implied, regarding the accuracy, completeness, or suitability of any content or products presented. Nothing on this website should be construed as legal, tax, investment, financial, medical, or other professional advice. In addition, no part of this site—including articles or product references—constitutes a solicitation, recommendation, endorsement, advertisement, or offer to buy or sell any securities, franchises, or other financial instruments, particularly in jurisdictions where such activity would be unlawful.
All content is of a general nature and may not address the specific circumstances of any individual or entity. It is not a substitute for professional advice or services. Any actions you take based on the information provided here are strictly at your own risk. You accept full responsibility for any decisions or outcomes arising from your use of this website and agree to release us from any liability in connection with your use of, or reliance upon, the content or products found herein.