
|
Ark Restaurants Corp. (ARKR) DCF -Bewertung |
Fully Editable: Tailor To Your Needs In Excel Or Sheets
Professional Design: Trusted, Industry-Standard Templates
Investor-Approved Valuation Models
MAC/PC Compatible, Fully Unlocked
No Expertise Is Needed; Easy To Follow
Ark Restaurants Corp. (ARKR) Bundle
Verbessern Sie Ihre Investitionsauswahl mit dem DCF -Taschenrechner der Ark Restaurants Corp. (ARKR)! Erforschen Sie reale Finanzdaten, passen Sie Wachstumsprojektionen und -kosten an und beobachten Sie sofort, wie sich diese Modifikationen auf den inneren Wert von Ark Restaurants Corp. (ARKR) auswirken.
What You Will Get
- Pre-Filled Financial Model: Ark Restaurants Corp.'s (ARKR) actual data allows for accurate DCF valuation.
- Full Forecast Control: Modify revenue growth, profit margins, WACC, and other essential drivers.
- Instant Calculations: Automatic updates provide real-time results as you make adjustments.
- Investor-Ready Template: A polished Excel file crafted for professional-level valuation.
- Customizable and Reusable: Designed for adaptability, enabling repeated use for in-depth forecasts.
Key Features
- Comprehensive ARKR Data: Pre-filled with Ark Restaurants Corp.'s historical financial performance and future projections.
- Customizable Financial Inputs: Tailor revenue growth, profit margins, discount rates, tax considerations, and capital expenditures.
- Dynamic Valuation Framework: Automatic recalculations of Net Present Value (NPV) and intrinsic value based on user-defined parameters.
- Scenario Analysis: Develop various forecasting scenarios to evaluate different valuation results.
- User-Centric Interface: Intuitive, organized, and crafted for both industry professionals and newcomers.
How It Works
- Step 1: Download the prebuilt Excel template featuring Ark Restaurants Corp.'s (ARKR) data.
- Step 2: Navigate through the pre-filled sheets to familiarize yourself with the essential metrics.
- Step 3: Modify the forecasts and assumptions in the editable yellow cells (WACC, growth, margins).
- Step 4: Instantly see the recalculated results, including Ark Restaurants Corp.'s (ARKR) intrinsic value.
- Step 5: Make well-informed investment decisions or create reports based on the outputs.
Why Choose This Calculator for Ark Restaurants Corp. (ARKR)?
- Accuracy: Utilizes real Ark Restaurants financials to ensure precise data.
- Flexibility: Tailored for users to easily test and adjust inputs as needed.
- Time-Saving: Avoid the complexities of creating a DCF model from the ground up.
- Professional-Grade: Crafted with the expertise and usability expected at the CFO level.
- User-Friendly: Intuitive design makes it accessible for users without advanced financial modeling skills.
Who Should Use Ark Restaurants Corp. (ARKR)?
- Investors: Gain insights into the dining industry with a reliable analysis of Ark Restaurants Corp. (ARKR).
- Financial Analysts: Utilize comprehensive reports to streamline your evaluation of restaurant performance.
- Consultants: Tailor presentations for clients by leveraging detailed market data on Ark Restaurants Corp. (ARKR).
- Food Industry Enthusiasts: Explore the dynamics of the restaurant sector through real-time case studies involving Ark Restaurants Corp. (ARKR).
- Educators and Students: Incorporate Ark Restaurants Corp. (ARKR) into finance and business curricula for practical applications.
What the Template Contains
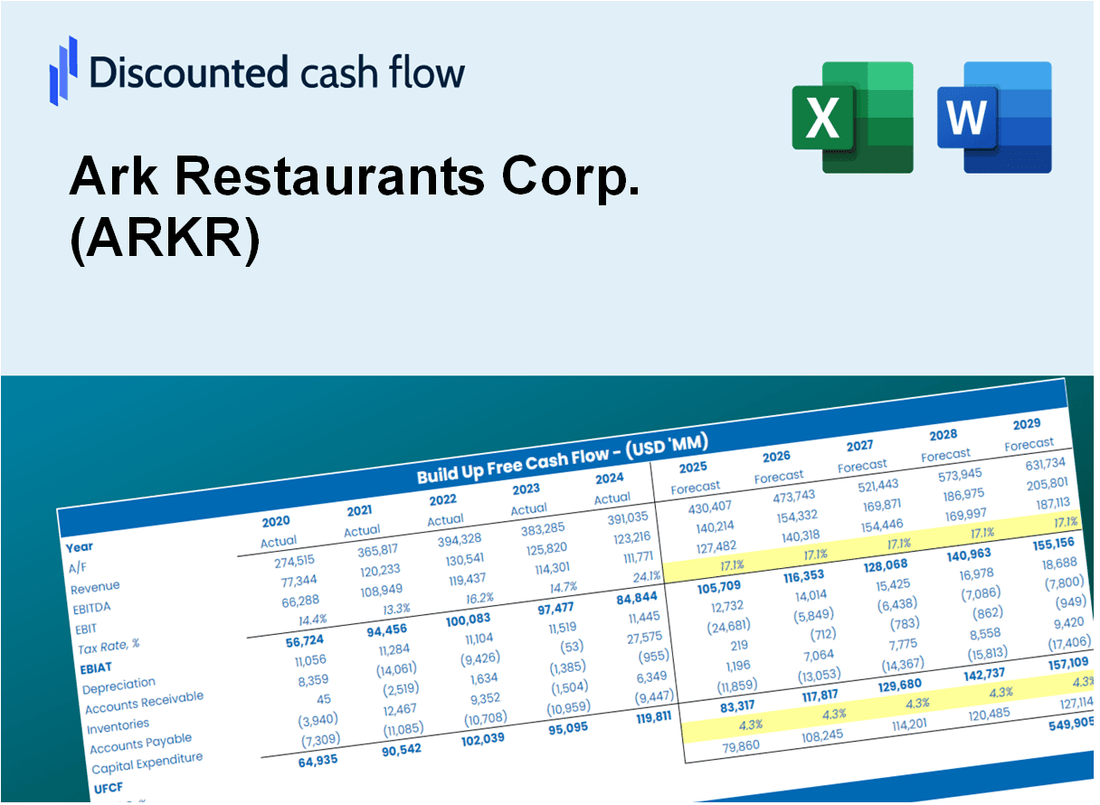
- Preloaded ARKR Data: Historical and projected financial data, including revenue, EBIT, and capital expenditures.
- DCF and WACC Models: Professional-grade sheets for calculating intrinsic value and Weighted Average Cost of Capital.
- Editable Inputs: Yellow-highlighted cells for adjusting revenue growth, tax rates, and discount rates.
- Financial Statements: Comprehensive annual and quarterly financials for deeper analysis.
- Key Ratios: Profitability, leverage, and efficiency ratios to evaluate performance.
- Dashboard and Charts: Visual summaries of valuation outcomes and assumptions.
Disclaimer
All information, articles, and product details provided on this website are for general informational and educational purposes only. We do not claim any ownership over, nor do we intend to infringe upon, any trademarks, copyrights, logos, brand names, or other intellectual property mentioned or depicted on this site. Such intellectual property remains the property of its respective owners, and any references here are made solely for identification or informational purposes, without implying any affiliation, endorsement, or partnership.
We make no representations or warranties, express or implied, regarding the accuracy, completeness, or suitability of any content or products presented. Nothing on this website should be construed as legal, tax, investment, financial, medical, or other professional advice. In addition, no part of this site—including articles or product references—constitutes a solicitation, recommendation, endorsement, advertisement, or offer to buy or sell any securities, franchises, or other financial instruments, particularly in jurisdictions where such activity would be unlawful.
All content is of a general nature and may not address the specific circumstances of any individual or entity. It is not a substitute for professional advice or services. Any actions you take based on the information provided here are strictly at your own risk. You accept full responsibility for any decisions or outcomes arising from your use of this website and agree to release us from any liability in connection with your use of, or reliance upon, the content or products found herein.