
|
ARLO Technologies, Inc. (ARLO) DCF -Bewertung |
Fully Editable: Tailor To Your Needs In Excel Or Sheets
Professional Design: Trusted, Industry-Standard Templates
Investor-Approved Valuation Models
MAC/PC Compatible, Fully Unlocked
No Expertise Is Needed; Easy To Follow
Arlo Technologies, Inc. (ARLO) Bundle
Möchten Sie den inneren Wert von ARLO Technologies, Inc. bestimmen? Unser (ARLO) DCF-Taschenrechner integriert reale Daten mit umfangreichen Anpassungsfunktionen, sodass Sie Prognosen anpassen und Ihre Anlagestrategien verbessern können.
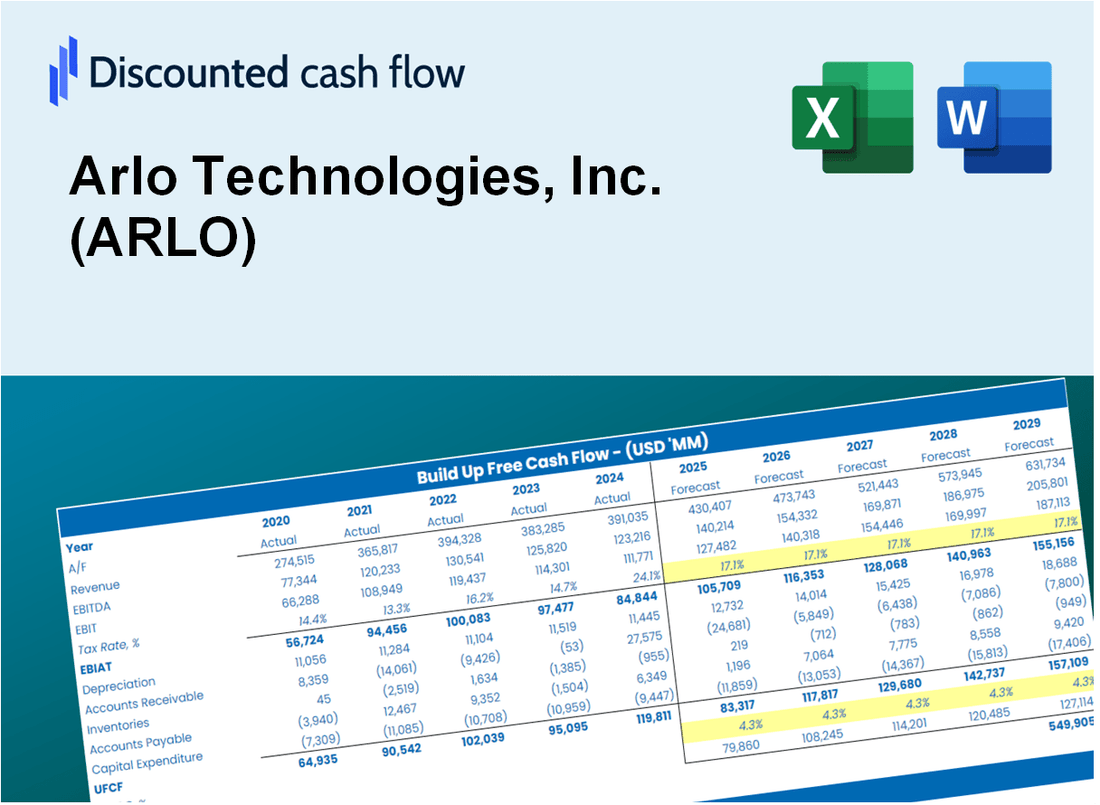
Discounted Cash Flow (DCF) - (USD MM)
| Year | AY1 2020 |
AY2 2021 |
AY3 2022 |
AY4 2023 |
AY5 2024 |
FY1 2025 |
FY2 2026 |
FY3 2027 |
FY4 2028 |
FY5 2029 |
|---|---|---|---|---|---|---|---|---|---|---|
| Revenue | 357.2 | 435.1 | 490.4 | 491.2 | 510.9 | 560.3 | 614.5 | 674.0 | 739.2 | 810.8 |
| Revenue Growth, % | 0 | 21.83 | 12.7 | 0.15538 | 4.01 | 9.68 | 9.68 | 9.68 | 9.68 | 9.68 |
| EBITDA | -94.7 | -45.0 | -52.1 | -20.2 | -31.7 | -64.8 | -71.0 | -77.9 | -85.5 | -93.7 |
| EBITDA, % | -26.5 | -10.35 | -10.63 | -4.12 | -6.2 | -11.56 | -11.56 | -11.56 | -11.56 | -11.56 |
| Depreciation | 10.2 | 6.0 | 4.8 | 4.7 | 3.2 | 7.6 | 8.3 | 9.1 | 10.0 | 11.0 |
| Depreciation, % | 2.86 | 1.37 | 0.97224 | 0.94895 | 0.62636 | 1.36 | 1.36 | 1.36 | 1.36 | 1.36 |
| EBIT | -104.9 | -51.0 | -56.9 | -24.9 | -34.9 | -72.4 | -79.4 | -87.1 | -95.5 | -104.7 |
| EBIT, % | -29.36 | -11.73 | -11.6 | -5.07 | -6.83 | -12.92 | -12.92 | -12.92 | -12.92 | -12.92 |
| Total Cash | 206.1 | 175.7 | 113.7 | 136.5 | 151.5 | 200.3 | 219.7 | 240.9 | 264.2 | 289.8 |
| Total Cash, percent | .0 | .0 | .0 | .0 | .0 | .0 | .0 | .0 | .0 | .0 |
| Account Receivables | 77.6 | 79.6 | 66.0 | 65.4 | 57.3 | 87.4 | 95.9 | 105.1 | 115.3 | 126.5 |
| Account Receivables, % | 21.74 | 18.28 | 13.45 | 13.31 | 11.22 | 15.6 | 15.6 | 15.6 | 15.6 | 15.6 |
| Inventories | 64.7 | 38.4 | 46.6 | 38.4 | 40.6 | 58.5 | 64.2 | 70.4 | 77.2 | 84.7 |
| Inventories, % | 18.12 | 8.82 | 9.49 | 7.82 | 7.95 | 10.44 | 10.44 | 10.44 | 10.44 | 10.44 |
| Accounts Payable | 62.2 | 84.1 | 52.1 | 55.2 | 63.8 | 79.7 | 87.4 | 95.8 | 105.1 | 115.3 |
| Accounts Payable, % | 17.41 | 19.33 | 10.63 | 11.24 | 12.48 | 14.22 | 14.22 | 14.22 | 14.22 | 14.22 |
| Capital Expenditure | -3.9 | -2.3 | -2.0 | -2.8 | -2.7 | -3.5 | -3.8 | -4.2 | -4.6 | -5.1 |
| Capital Expenditure, % | -1.09 | -0.52122 | -0.40986 | -0.57963 | -0.52614 | -0.62531 | -0.62531 | -0.62531 | -0.62531 | -0.62531 |
| Tax Rate, % | -3.71 | -3.71 | -3.71 | -3.71 | -3.71 | -3.71 | -3.71 | -3.71 | -3.71 | -3.71 |
| EBITAT | -105.5 | -51.6 | -57.9 | -26.3 | -36.2 | -72.4 | -79.4 | -87.1 | -95.5 | -104.7 |
| Depreciation | ||||||||||
| Changes in Account Receivables | ||||||||||
| Changes in Inventories | ||||||||||
| Changes in Accounts Payable | ||||||||||
| Capital Expenditure | ||||||||||
| UFCF | -179.4 | -1.6 | -81.6 | -12.7 | -21.3 | -100.4 | -81.3 | -89.2 | -97.8 | -107.3 |
| WACC, % | 11.7 | 11.7 | 11.7 | 11.7 | 11.7 | 11.7 | 11.7 | 11.7 | 11.7 | 11.7 |
| PV UFCF | ||||||||||
| SUM PV UFCF | -343.5 | |||||||||
| Long Term Growth Rate, % | 4.00 | |||||||||
| Free cash flow (T + 1) | -112 | |||||||||
| Terminal Value | -1,448 | |||||||||
| Present Terminal Value | -833 | |||||||||
| Enterprise Value | -1,176 | |||||||||
| Net Debt | -64 | |||||||||
| Equity Value | -1,113 | |||||||||
| Diluted Shares Outstanding, MM | 99 | |||||||||
| Equity Value Per Share | -11.28 |
What You Will Receive
- Pre-Filled Financial Model: Arlo Technologies’ actual data allows for accurate DCF valuation.
- Comprehensive Forecast Control: Modify revenue growth, margins, WACC, and other essential factors.
- Real-Time Calculations: Automatic updates provide immediate insights as you make adjustments.
- Professional-Grade Template: A polished Excel file crafted for high-quality valuation.
- Flexible and Reusable: Designed for adaptability, enabling repeated use for in-depth forecasts.
Key Features
- Current ARLO Data: Pre-loaded with Arlo Technologies' historical performance metrics and future growth estimates.
- Customizable Parameters: Modify key factors such as revenue growth rates, profit margins, discount rates, tax implications, and capital investments.
- Interactive Valuation Framework: Real-time adjustments to Net Present Value (NPV) and intrinsic value based on your customized inputs.
- Scenario Analysis: Develop various forecasting scenarios to explore different valuation possibilities.
- Intuitive Interface: Designed to be straightforward and accessible for both seasoned professionals and newcomers.
How It Works
- 1. Access the Template: Download and open the Excel file containing Arlo Technologies, Inc.'s preloaded data.
- 2. Adjust Assumptions: Modify essential inputs such as growth projections, WACC, and capital expenditures.
- 3. Instant Results: The DCF model automatically computes intrinsic value and NPV in real-time.
- 4. Explore Scenarios: Evaluate various forecasts to understand different valuation results.
- 5. Present with Assurance: Showcase professional valuation insights to enhance your decision-making.
Why Choose This Calculator for Arlo Technologies, Inc. (ARLO)?
- All-in-One Solution: Combines DCF, WACC, and financial ratio analyses tailored for Arlo Technologies.
- Flexible Inputs: Modify the yellow-highlighted cells to explore different financial scenarios for (ARLO).
- In-Depth Analysis: Automatically computes Arlo's intrinsic value and Net Present Value for informed decision-making.
- Data-Rich Environment: Access to historical and projected data provides reliable foundations for analysis.
- Expert-Level Quality: Perfect for financial analysts, investors, and consultants focused on (ARLO).
Who Should Use This Product?
- Investors: Accurately estimate Arlo Technologies’ fair value before making investment decisions.
- CFOs: Leverage a professional-grade DCF model for financial reporting and analysis specific to Arlo Technologies (ARLO).
- Consultants: Quickly adapt the template for valuation reports tailored to Arlo Technologies (ARLO) clients.
- Entrepreneurs: Gain insights into financial modeling practices utilized by leading tech firms like Arlo Technologies (ARLO).
- Educators: Use it as a teaching tool to demonstrate valuation methodologies relevant to companies like Arlo Technologies (ARLO).
What the Template Contains
- Historical Data: Includes Arlo Technologies' past financials and baseline forecasts.
- DCF and Levered DCF Models: Detailed templates to calculate Arlo Technologies' intrinsic value.
- WACC Sheet: Pre-built calculations for Weighted Average Cost of Capital.
- Editable Inputs: Modify key drivers like growth rates, EBITDA %, and CAPEX assumptions.
- Quarterly and Annual Statements: A complete breakdown of Arlo Technologies' financials.
- Interactive Dashboard: Visualize valuation results and projections dynamically.
Disclaimer
All information, articles, and product details provided on this website are for general informational and educational purposes only. We do not claim any ownership over, nor do we intend to infringe upon, any trademarks, copyrights, logos, brand names, or other intellectual property mentioned or depicted on this site. Such intellectual property remains the property of its respective owners, and any references here are made solely for identification or informational purposes, without implying any affiliation, endorsement, or partnership.
We make no representations or warranties, express or implied, regarding the accuracy, completeness, or suitability of any content or products presented. Nothing on this website should be construed as legal, tax, investment, financial, medical, or other professional advice. In addition, no part of this site—including articles or product references—constitutes a solicitation, recommendation, endorsement, advertisement, or offer to buy or sell any securities, franchises, or other financial instruments, particularly in jurisdictions where such activity would be unlawful.
All content is of a general nature and may not address the specific circumstances of any individual or entity. It is not a substitute for professional advice or services. Any actions you take based on the information provided here are strictly at your own risk. You accept full responsibility for any decisions or outcomes arising from your use of this website and agree to release us from any liability in connection with your use of, or reliance upon, the content or products found herein.