
|
Alliance Resource Partners, L.P. (ARLP) DCF -Bewertung |
Fully Editable: Tailor To Your Needs In Excel Or Sheets
Professional Design: Trusted, Industry-Standard Templates
Investor-Approved Valuation Models
MAC/PC Compatible, Fully Unlocked
No Expertise Is Needed; Easy To Follow
Alliance Resource Partners, L.P. (ARLP) Bundle
Möchten Sie den inneren Wert von Alliance Resource Partners, L.P., einschätzen? Unser (ARLP) DCF-Taschenrechner integriert reale Daten mit umfangreichen Anpassungsfunktionen, sodass Sie Ihre Prognosen verfeinern und Ihre Investitionsauswahl verbessern können.
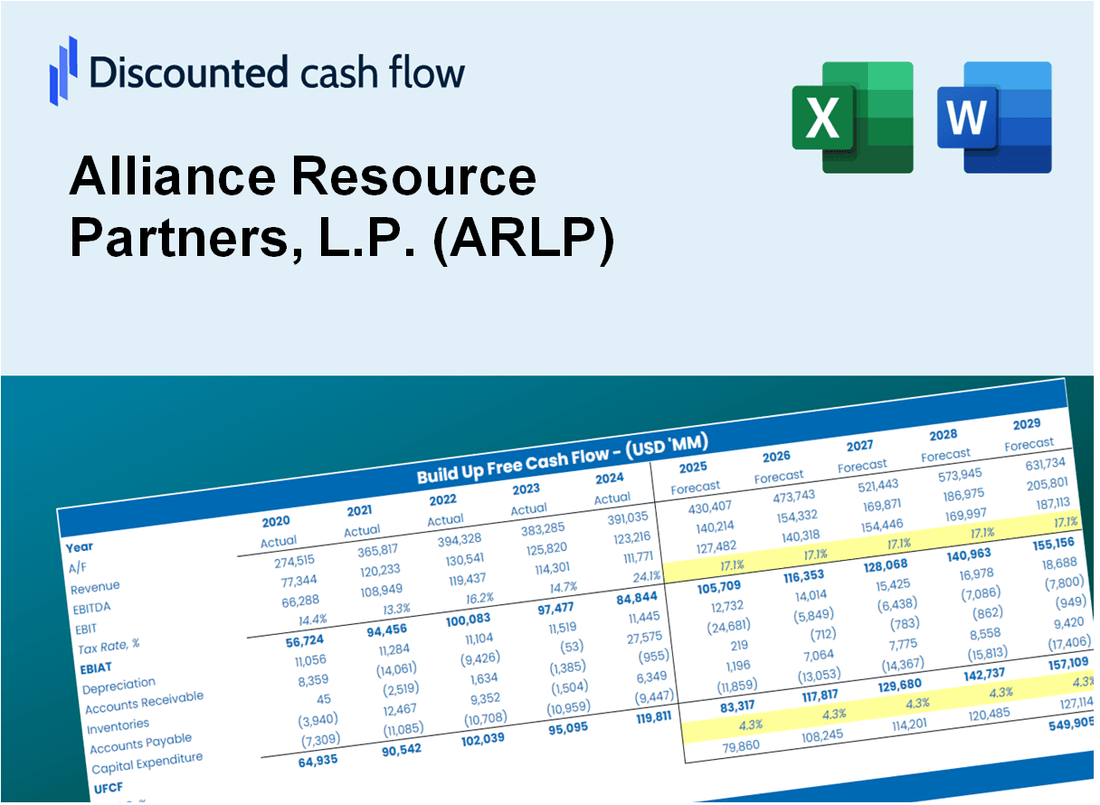
Discounted Cash Flow (DCF) - (USD MM)
| Year | AY1 2020 |
AY2 2021 |
AY3 2022 |
AY4 2023 |
AY5 2024 |
FY1 2025 |
FY2 2026 |
FY3 2027 |
FY4 2028 |
FY5 2029 |
|---|---|---|---|---|---|---|---|---|---|---|
| Revenue | 1,328.1 | 1,570.0 | 2,420.0 | 2,566.7 | 2,448.7 | 2,900.6 | 3,435.9 | 4,069.9 | 4,821.0 | 5,710.7 |
| Revenue Growth, % | 0 | 18.21 | 54.14 | 6.06 | -4.6 | 18.45 | 18.45 | 18.45 | 18.45 | 18.45 |
| EBITDA | 234.0 | 483.5 | 956.1 | 948.5 | 702.2 | 890.8 | 1,055.2 | 1,249.9 | 1,480.6 | 1,753.8 |
| EBITDA, % | 17.62 | 30.79 | 39.51 | 36.95 | 28.68 | 30.71 | 30.71 | 30.71 | 30.71 | 30.71 |
| Depreciation | 317.4 | 265.1 | 276.7 | 268.0 | 285.4 | 431.1 | 510.7 | 604.9 | 716.5 | 848.8 |
| Depreciation, % | 23.9 | 16.88 | 11.43 | 10.44 | 11.66 | 14.86 | 14.86 | 14.86 | 14.86 | 14.86 |
| EBIT | -83.4 | 218.4 | 679.5 | 680.5 | 416.7 | 459.7 | 544.5 | 645.0 | 764.0 | 905.0 |
| EBIT, % | -6.28 | 13.91 | 28.08 | 26.51 | 17.02 | 15.85 | 15.85 | 15.85 | 15.85 | 15.85 |
| Total Cash | 55.6 | 122.4 | 296.0 | 59.8 | 137.0 | 186.4 | 220.8 | 261.6 | 309.9 | 367.0 |
| Total Cash, percent | .0 | .0 | .0 | .0 | .0 | .0 | .0 | .0 | .0 | .0 |
| Account Receivables | 108.1 | 130.2 | 250.0 | 292.3 | 177.0 | 263.2 | 311.8 | 369.4 | 437.5 | 518.3 |
| Account Receivables, % | 8.14 | 8.29 | 10.33 | 11.39 | 7.23 | 9.08 | 9.08 | 9.08 | 9.08 | 9.08 |
| Inventories | 56.4 | 60.3 | 77.3 | 127.6 | 120.7 | 122.9 | 145.5 | 172.4 | 204.2 | 241.9 |
| Inventories, % | 4.25 | 3.84 | 3.2 | 4.97 | 4.93 | 4.24 | 4.24 | 4.24 | 4.24 | 4.24 |
| Accounts Payable | 47.5 | 69.6 | 95.1 | 108.3 | 98.2 | 117.0 | 138.6 | 164.2 | 194.5 | 230.3 |
| Accounts Payable, % | 3.58 | 4.43 | 3.93 | 4.22 | 4.01 | 4.03 | 4.03 | 4.03 | 4.03 | 4.03 |
| Capital Expenditure | -121.1 | -153.9 | -286.4 | -468.6 | -428.7 | -385.9 | -457.1 | -541.5 | -641.4 | -759.8 |
| Capital Expenditure, % | -9.12 | -9.81 | -11.83 | -18.26 | -17.51 | -13.3 | -13.3 | -13.3 | -13.3 | -13.3 |
| Tax Rate, % | 5.41 | 5.41 | 5.41 | 5.41 | 5.41 | 5.41 | 5.41 | 5.41 | 5.41 | 5.41 |
| EBITAT | -83.4 | 222.8 | 620.3 | 665.4 | 394.2 | 444.7 | 526.7 | 623.9 | 739.1 | 875.5 |
| Depreciation | ||||||||||
| Changes in Account Receivables | ||||||||||
| Changes in Inventories | ||||||||||
| Changes in Accounts Payable | ||||||||||
| Capital Expenditure | ||||||||||
| UFCF | -4.1 | 329.9 | 499.3 | 385.5 | 363.0 | 420.2 | 530.6 | 628.5 | 744.5 | 881.9 |
| WACC, % | 6.09 | 6.09 | 6 | 6.06 | 6.03 | 6.05 | 6.05 | 6.05 | 6.05 | 6.05 |
| PV UFCF | ||||||||||
| SUM PV UFCF | 2,640.8 | |||||||||
| Long Term Growth Rate, % | 0.50 | |||||||||
| Free cash flow (T + 1) | 886 | |||||||||
| Terminal Value | 15,962 | |||||||||
| Present Terminal Value | 11,898 | |||||||||
| Enterprise Value | 14,539 | |||||||||
| Net Debt | 350 | |||||||||
| Equity Value | 14,189 | |||||||||
| Diluted Shares Outstanding, MM | 128 | |||||||||
| Equity Value Per Share | 110.88 |
What You Will Get
- Real ARLP Financial Data: Pre-filled with Alliance Resource Partners’ historical and projected data for precise analysis.
- Fully Editable Template: Modify key inputs like revenue growth, WACC, and EBITDA % with ease.
- Automatic Calculations: See Alliance Resource Partners’ intrinsic value update instantly based on your changes.
- Professional Valuation Tool: Designed for investors, analysts, and consultants seeking accurate DCF results.
- User-Friendly Design: Simple structure and clear instructions for all experience levels.
Key Features
- Comprehensive ARLP Data: Pre-loaded with Alliance Resource Partners’ historical performance and future projections.
- Customizable Parameters: Tailor revenue growth, profit margins, discount rates, tax implications, and capital investments.
- Interactive Valuation Framework: Automatic recalculations of Net Present Value (NPV) and intrinsic value based on user inputs.
- Scenario Analysis: Develop various forecasting scenarios to evaluate different valuation possibilities.
- Intuitive Interface: Designed to be straightforward and accessible for both experienced users and newcomers.
How It Works
- Download the Template: Get instant access to the Excel-based ARLP DCF Calculator.
- Input Your Assumptions: Adjust yellow-highlighted cells for growth rates, WACC, margins, and more.
- Instant Calculations: The model automatically updates Alliance Resource Partners’ intrinsic value.
- Test Scenarios: Simulate different assumptions to evaluate potential valuation changes.
- Analyze and Decide: Use the results to guide your investment or financial analysis.
Why Choose This Calculator for Alliance Resource Partners, L.P. (ARLP)?
- Accuracy: Utilizes real Alliance Resource Partners financials for precise data.
- Flexibility: Allows users to easily test and adjust inputs as needed.
- Time-Saving: Eliminate the complexities of creating a DCF model from the ground up.
- Professional-Grade: Crafted with the expertise and usability expected by CFOs.
- User-Friendly: Intuitive design makes it accessible for users without extensive financial modeling skills.
Who Should Use This Product?
- Finance Students: Explore the intricacies of coal mining valuation and apply your knowledge using real market data for Alliance Resource Partners, L.P. (ARLP).
- Academics: Integrate industry-specific financial models into your research or teaching materials related to energy and resources.
- Investors: Validate your investment strategies and evaluate the financial performance of Alliance Resource Partners, L.P. (ARLP).
- Analysts: Enhance your analytical capabilities with a ready-to-use, customizable DCF model tailored for the energy sector.
- Small Business Owners: Understand the valuation methodologies used to assess large energy companies like Alliance Resource Partners, L.P. (ARLP).
What the Template Contains
- Preloaded ARLP Data: Historical and projected financial data, including revenue, EBIT, and capital expenditures.
- DCF and WACC Models: Professional-grade sheets for calculating intrinsic value and Weighted Average Cost of Capital.
- Editable Inputs: Yellow-highlighted cells for adjusting revenue growth, tax rates, and discount rates.
- Financial Statements: Comprehensive annual and quarterly financials for deeper analysis.
- Key Ratios: Profitability, leverage, and efficiency ratios to evaluate performance.
- Dashboard and Charts: Visual summaries of valuation outcomes and assumptions.
Disclaimer
All information, articles, and product details provided on this website are for general informational and educational purposes only. We do not claim any ownership over, nor do we intend to infringe upon, any trademarks, copyrights, logos, brand names, or other intellectual property mentioned or depicted on this site. Such intellectual property remains the property of its respective owners, and any references here are made solely for identification or informational purposes, without implying any affiliation, endorsement, or partnership.
We make no representations or warranties, express or implied, regarding the accuracy, completeness, or suitability of any content or products presented. Nothing on this website should be construed as legal, tax, investment, financial, medical, or other professional advice. In addition, no part of this site—including articles or product references—constitutes a solicitation, recommendation, endorsement, advertisement, or offer to buy or sell any securities, franchises, or other financial instruments, particularly in jurisdictions where such activity would be unlawful.
All content is of a general nature and may not address the specific circumstances of any individual or entity. It is not a substitute for professional advice or services. Any actions you take based on the information provided here are strictly at your own risk. You accept full responsibility for any decisions or outcomes arising from your use of this website and agree to release us from any liability in connection with your use of, or reliance upon, the content or products found herein.