
|
Arcutis Biotherapeutics, Inc. (ARQT) DCF -Bewertung |
Fully Editable: Tailor To Your Needs In Excel Or Sheets
Professional Design: Trusted, Industry-Standard Templates
Investor-Approved Valuation Models
MAC/PC Compatible, Fully Unlocked
No Expertise Is Needed; Easy To Follow
Arcutis Biotherapeutics, Inc. (ARQT) Bundle
Unabhängig davon, ob Sie ein Investor oder Analyst sind, ist dieser (ARQT) DCF -Taschenrechner Ihr wesentliches Werkzeug für eine genaue Bewertung. Mit Arcutis Biotherapeutics, Inc. Real Data können Sie Prognosen anpassen und die Auswirkungen in Echtzeit beobachten.
What You Will Get
- Real ARQT Financial Data: Pre-filled with Arcutis Biotherapeutics’ historical and projected data for precise analysis.
- Fully Editable Template: Modify key inputs like revenue growth, WACC, and EBITDA % with ease.
- Automatic Calculations: See Arcutis Biotherapeutics’ intrinsic value update instantly based on your changes.
- Professional Valuation Tool: Designed for investors, analysts, and consultants seeking accurate DCF results.
- User-Friendly Design: Simple structure and clear instructions for all experience levels.
Key Features
- Real-Life ARQT Data: Pre-filled with Arcutis Biotherapeutics' historical financials and forward-looking projections.
- Fully Customizable Inputs: Adjust revenue growth, margins, WACC, tax rates, and capital expenditures.
- Dynamic Valuation Model: Automatic updates to Net Present Value (NPV) and intrinsic value based on your inputs.
- Scenario Testing: Create multiple forecast scenarios to analyze different valuation outcomes.
- User-Friendly Design: Simple, structured, and designed for professionals and beginners alike.
How It Works
- Download the Template: Gain immediate access to the Excel-based ARQT DCF Calculator.
- Input Your Assumptions: Modify the yellow-highlighted cells for growth rates, WACC, margins, and other variables.
- Instant Calculations: The model automatically recalculates Arcutis Biotherapeutics' intrinsic value.
- Test Scenarios: Experiment with different assumptions to assess potential changes in valuation.
- Analyze and Decide: Utilize the results to inform your investment or financial analysis.
Why Choose This Calculator for Arcutis Biotherapeutics, Inc. (ARQT)?
- Designed for Experts: An advanced tool utilized by researchers, financial analysts, and industry professionals.
- Accurate Data: Arcutis’ historical and forecasted financial information preloaded for precision.
- Flexible Scenario Analysis: Effortlessly test various projections and assumptions.
- Insightful Outputs: Automatically computes intrinsic value, NPV, and essential financial metrics.
- User-Friendly: Comprehensive instructions lead you through each step of the calculation.
Who Should Use This Product?
- Healthcare Professionals: Understand innovative dermatological treatments and their market potential.
- Researchers: Utilize advanced models to study the efficacy of Arcutis' therapies in clinical settings.
- Investors: Evaluate your investment strategies and analyze the market performance of Arcutis Biotherapeutics (ARQT).
- Pharmaceutical Analysts: Enhance your analysis with a customizable model tailored to biopharmaceutical valuations.
- Entrepreneurs: Discover how biopharmaceutical companies like Arcutis are assessed in the industry.
What the Template Contains
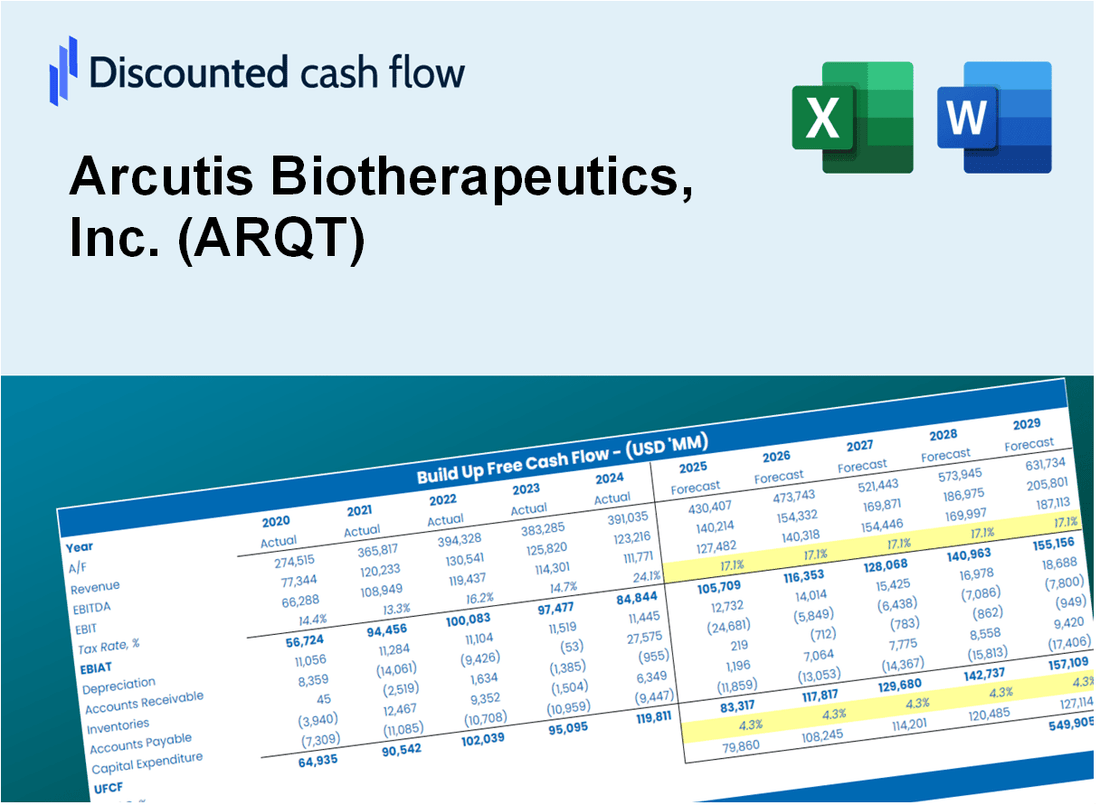
- Preloaded ARQT Data: Historical and projected financial data, including revenue, EBIT, and capital expenditures.
- DCF and WACC Models: Professional-grade sheets for calculating intrinsic value and Weighted Average Cost of Capital.
- Editable Inputs: Yellow-highlighted cells for adjusting revenue growth, tax rates, and discount rates.
- Financial Statements: Comprehensive annual and quarterly financials for deeper analysis.
- Key Ratios: Profitability, leverage, and efficiency ratios to evaluate performance.
- Dashboard and Charts: Visual summaries of valuation outcomes and assumptions.
Disclaimer
All information, articles, and product details provided on this website are for general informational and educational purposes only. We do not claim any ownership over, nor do we intend to infringe upon, any trademarks, copyrights, logos, brand names, or other intellectual property mentioned or depicted on this site. Such intellectual property remains the property of its respective owners, and any references here are made solely for identification or informational purposes, without implying any affiliation, endorsement, or partnership.
We make no representations or warranties, express or implied, regarding the accuracy, completeness, or suitability of any content or products presented. Nothing on this website should be construed as legal, tax, investment, financial, medical, or other professional advice. In addition, no part of this site—including articles or product references—constitutes a solicitation, recommendation, endorsement, advertisement, or offer to buy or sell any securities, franchises, or other financial instruments, particularly in jurisdictions where such activity would be unlawful.
All content is of a general nature and may not address the specific circumstances of any individual or entity. It is not a substitute for professional advice or services. Any actions you take based on the information provided here are strictly at your own risk. You accept full responsibility for any decisions or outcomes arising from your use of this website and agree to release us from any liability in connection with your use of, or reliance upon, the content or products found herein.