
|
Arvind Fashions Limited (arvindfasn.ns) DCF -Bewertung |
Fully Editable: Tailor To Your Needs In Excel Or Sheets
Professional Design: Trusted, Industry-Standard Templates
Investor-Approved Valuation Models
MAC/PC Compatible, Fully Unlocked
No Expertise Is Needed; Easy To Follow
Arvind Fashions Limited (ARVINDFASN.NS) Bundle
Vereinfachen Sie die Bewertung von Arvind Fashions Limited (Arvindfasnns) mit diesem anpassbaren DCF -Taschenrechner! Mit Real Arvind Fashions Limited Financials und einstellbaren Prognoseeingaben können Sie Szenarien testen und Arvind Fashions Limited Fair Value in Minuten aufdecken.
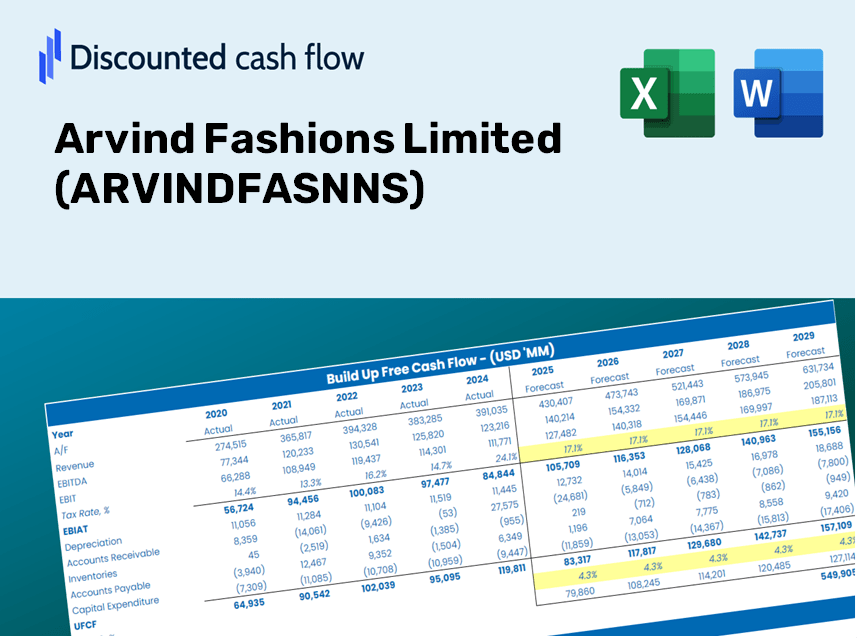
Discounted Cash Flow (DCF) - (USD MM)
| Year | AY1 2021 |
AY2 2022 |
AY3 2023 |
AY4 2024 |
AY5 2025 |
FY1 2026 |
FY2 2027 |
FY3 2028 |
FY4 2029 |
FY5 2030 |
|---|---|---|---|---|---|---|---|---|---|---|
| Revenue | 19,103.7 | 30,524.0 | 40,644.4 | 42,515.5 | 46,198.4 | 58,464.3 | 73,986.9 | 93,630.9 | 118,490.4 | 149,950.2 |
| Revenue Growth, % | 0 | 59.78 | 33.16 | 4.6 | 8.66 | 26.55 | 26.55 | 26.55 | 26.55 | 26.55 |
| EBITDA | 643.2 | 2,576.5 | 4,877.2 | 5,333.4 | 6,020.0 | 5,774.3 | 7,307.4 | 9,247.5 | 11,702.8 | 14,809.9 |
| EBITDA, % | 3.37 | 8.44 | 12 | 12.54 | 13.03 | 9.88 | 9.88 | 9.88 | 9.88 | 9.88 |
| Depreciation | 2,378.4 | 2,330.0 | 2,030.7 | 2,492.2 | 2,557.2 | 4,265.2 | 5,397.6 | 6,830.7 | 8,644.3 | 10,939.4 |
| Depreciation, % | 12.45 | 7.63 | 5 | 5.86 | 5.54 | 7.3 | 7.3 | 7.3 | 7.3 | 7.3 |
| EBIT | -1,735.2 | 246.5 | 2,846.5 | 2,841.2 | 3,462.8 | 1,509.1 | 1,909.8 | 2,416.8 | 3,058.5 | 3,870.6 |
| EBIT, % | -9.08 | 0.80756 | 7 | 6.68 | 7.5 | 2.58 | 2.58 | 2.58 | 2.58 | 2.58 |
| Total Cash | 80.1 | 866.7 | 1,790.7 | 1,531.5 | 1,519.0 | 1,701.9 | 2,153.7 | 2,725.5 | 3,449.2 | 4,365.0 |
| Total Cash, percent | .0 | .0 | .0 | .0 | .0 | .0 | .0 | .0 | .0 | .0 |
| Account Receivables | 6,615.0 | 6,297.8 | 5,778.7 | 6,663.5 | 7,309.9 | 11,806.6 | 14,941.3 | 18,908.3 | 23,928.6 | 30,281.8 |
| Account Receivables, % | 34.63 | 20.63 | 14.22 | 15.67 | 15.82 | 20.19 | 20.19 | 20.19 | 20.19 | 20.19 |
| Inventories | 8,100.1 | 8,308.1 | 9,819.0 | 9,094.4 | 10,800.5 | 16,200.1 | 20,501.3 | 25,944.5 | 32,832.9 | 41,550.2 |
| Inventories, % | 42.4 | 27.22 | 24.16 | 21.39 | 23.38 | 27.71 | 27.71 | 27.71 | 27.71 | 27.71 |
| Accounts Payable | 9,180.0 | 10,478.7 | 10,195.0 | 9,363.1 | 11,719.8 | 18,107.3 | 22,914.9 | 28,998.9 | 36,698.2 | 46,441.8 |
| Accounts Payable, % | 48.05 | 34.33 | 25.08 | 22.02 | 25.37 | 30.97 | 30.97 | 30.97 | 30.97 | 30.97 |
| Capital Expenditure | -455.3 | -89.6 | -632.4 | -822.7 | -958.2 | -963.7 | -1,219.6 | -1,543.4 | -1,953.2 | -2,471.8 |
| Capital Expenditure, % | -2.38 | -0.29354 | -1.56 | -1.94 | -2.07 | -1.65 | -1.65 | -1.65 | -1.65 | -1.65 |
| Tax Rate, % | 115.8 | 115.8 | 115.8 | 115.8 | 115.8 | 115.8 | 115.8 | 115.8 | 115.8 | 115.8 |
| EBITAT | -2,824.5 | 599.9 | 699.9 | 1,398.4 | -547.1 | 826.4 | 1,045.8 | 1,323.5 | 1,674.9 | 2,119.6 |
| Depreciation | ||||||||||
| Changes in Account Receivables | ||||||||||
| Changes in Inventories | ||||||||||
| Changes in Accounts Payable | ||||||||||
| Capital Expenditure | ||||||||||
| UFCF | -6,436.5 | 4,248.2 | 822.7 | 2,075.8 | 1,056.1 | 619.1 | 2,595.5 | 3,284.6 | 4,156.7 | 5,260.3 |
| WACC, % | 5.84 | 5.84 | 4.35 | 4.84 | 3.87 | 4.95 | 4.95 | 4.95 | 4.95 | 4.95 |
| PV UFCF | ||||||||||
| SUM PV UFCF | 13,345.3 | |||||||||
| Long Term Growth Rate, % | 3.50 | |||||||||
| Free cash flow (T + 1) | 5,444 | |||||||||
| Terminal Value | 375,474 | |||||||||
| Present Terminal Value | 294,895 | |||||||||
| Enterprise Value | 308,240 | |||||||||
| Net Debt | 9,921 | |||||||||
| Equity Value | 298,320 | |||||||||
| Diluted Shares Outstanding, MM | 133 | |||||||||
| Equity Value Per Share | 2,239.28 |
Benefits You Will Receive
- Authentic ARVINDFASNNS Financial Data: Pre-loaded with Arvind Fashions Limited’s historical and forecasted data for in-depth analysis.
- Completely Customizable Template: Effortlessly adjust key inputs such as revenue growth, WACC, and EBITDA percentage.
- Instantaneous Calculations: Watch as the intrinsic value of Arvind Fashions Limited updates in real-time with your modifications.
- Professional Valuation Tool: Tailored for investors, analysts, and consultants aiming for precise DCF results.
- User-Friendly Interface: Designed with a straightforward layout and easy-to-follow instructions suitable for all skill levels.
Key Features
- 🔍 Real-Life ARVINDFASNNS Financials: Pre-filled historical and projected data for Arvind Fashions Limited.
- ✏️ Fully Customizable Inputs: Modify all essential parameters (yellow cells) such as WACC, growth %, and tax rates.
- 📊 Professional DCF Valuation: Integrated formulas compute Arvind's intrinsic value using the Discounted Cash Flow method.
- ⚡ Instant Results: Visualize Arvind's valuation immediately after adjustments.
- Scenario Analysis: Evaluate and compare potential outcomes for different financial assumptions side-by-side.
How It Works
- Step 1: Download the Excel file.
- Step 2: Examine the pre-filled data for Arvind Fashions Limited (ARVINDFASNNS), including both historical and projected figures.
- Step 3: Modify the key assumptions (highlighted in yellow) according to your analysis.
- Step 4: Observe the automatic recalculations reflecting the intrinsic value of Arvind Fashions Limited (ARVINDFASNNS).
- Step 5: Utilize the results for your investment decisions or reporting needs.
Why Opt for This Calculator?
- Designed for Experts: A sophisticated tool utilized by financial analysts, CFOs, and industry consultants.
- Accurate Data: Arvind Fashions Limited’s historical and forecasted financial data is preloaded for precision.
- Forecast Simulations: Effortlessly test various scenarios and assumptions.
- Comprehensive Results: Automatically generates intrinsic value, NPV, and essential financial metrics.
- User-Friendly: Step-by-step guidance simplifies the calculation process.
Who Should Use This Product?
- Fashion Students: Discover industry-specific valuation methods and practice with real market data.
- Researchers: Utilize established models for academic projects or studies related to the fashion sector.
- Investors: Validate your investment hypotheses and assess valuation scenarios for Arvind Fashions Limited (ARVINDFASNNS).
- Market Analysts: Enhance your analytical processes with a customizable DCF model designed for fashion retail.
- Entrepreneurs: Learn valuable insights from the evaluation methods used for large fashion companies like Arvind Fashions Limited (ARVINDFASNNS).
Contents of the Template
- Preloaded ARVINDFASNNS Data: Historical and projected financial metrics, encompassing revenue, EBIT, and capital expenditures.
- DCF and WACC Models: Advanced sheets designed for calculating intrinsic value and Weighted Average Cost of Capital.
- Editable Inputs: Yellow-highlighted cells for modifying revenue growth, tax rates, and discount rates.
- Financial Statements: Detailed annual and quarterly financial reports for in-depth analysis.
- Key Ratios: Metrics for profitability, leverage, and efficiency to assess performance.
- Dashboard and Charts: Visual representations of valuation results and underlying assumptions.
Disclaimer
All information, articles, and product details provided on this website are for general informational and educational purposes only. We do not claim any ownership over, nor do we intend to infringe upon, any trademarks, copyrights, logos, brand names, or other intellectual property mentioned or depicted on this site. Such intellectual property remains the property of its respective owners, and any references here are made solely for identification or informational purposes, without implying any affiliation, endorsement, or partnership.
We make no representations or warranties, express or implied, regarding the accuracy, completeness, or suitability of any content or products presented. Nothing on this website should be construed as legal, tax, investment, financial, medical, or other professional advice. In addition, no part of this site—including articles or product references—constitutes a solicitation, recommendation, endorsement, advertisement, or offer to buy or sell any securities, franchises, or other financial instruments, particularly in jurisdictions where such activity would be unlawful.
All content is of a general nature and may not address the specific circumstances of any individual or entity. It is not a substitute for professional advice or services. Any actions you take based on the information provided here are strictly at your own risk. You accept full responsibility for any decisions or outcomes arising from your use of this website and agree to release us from any liability in connection with your use of, or reliance upon, the content or products found herein.