
|
Arrow Electronics, Inc. (ARW) DCF -Bewertung |
Fully Editable: Tailor To Your Needs In Excel Or Sheets
Professional Design: Trusted, Industry-Standard Templates
Investor-Approved Valuation Models
MAC/PC Compatible, Fully Unlocked
No Expertise Is Needed; Easy To Follow
Arrow Electronics, Inc. (ARW) Bundle
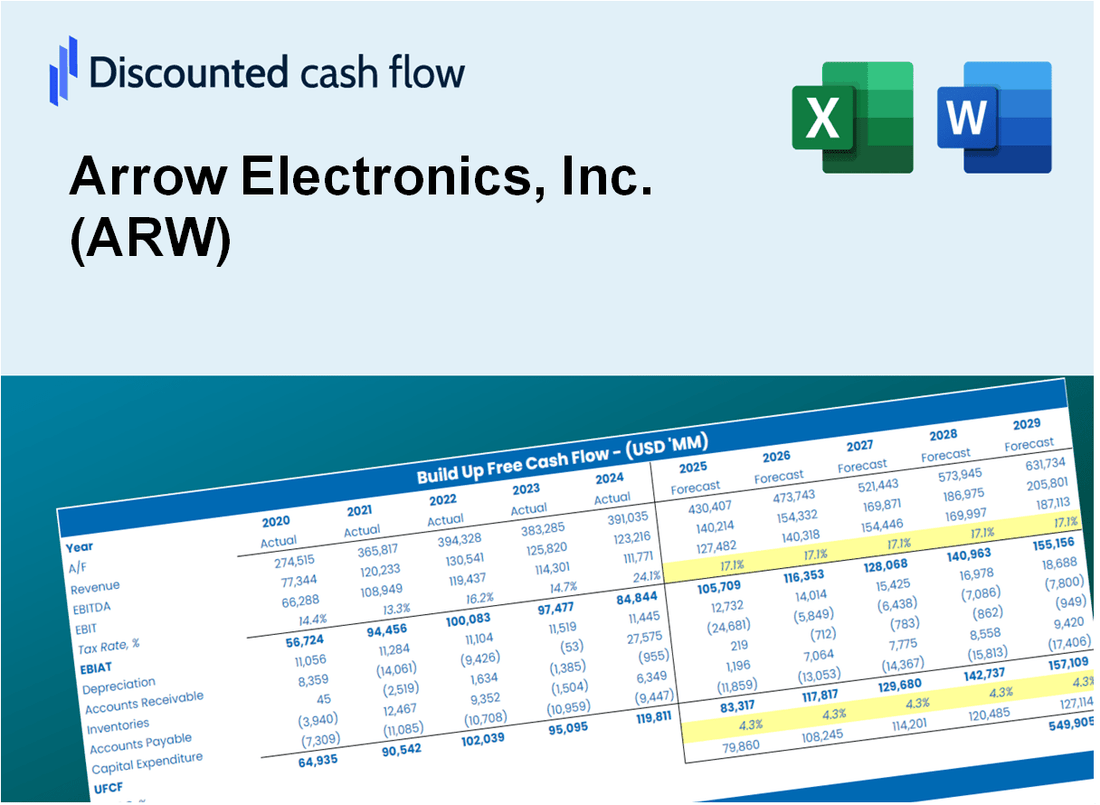
Gewinnen Sie einen Einblick in Ihre Arrow Electronics, Inc. (ARW) Bewertungsanalyse mit unserem ausgefeilten DCF -Taschenrechner! Mit dieser Excel-Vorlage mit Echtzeitdaten für (ARW) können Sie Prognosen und Annahmen anpassen, um den inneren Wert von Arrow Electronics, Inc. genau zu bestimmen.
What You Will Receive
- Authentic ARW Financial Data: Pre-populated with Arrow Electronics’ historical and forecasted data for accurate analysis.
- Completely Customizable Template: Easily adjust essential inputs such as revenue growth, WACC, and EBITDA %.
- Instant Calculations: Observe real-time updates of Arrow’s intrinsic value based on your modifications.
- Expert Valuation Tool: Tailored for investors, analysts, and consultants aiming for precise DCF outcomes.
- Intuitive Design: Streamlined layout and straightforward instructions suitable for all skill levels.
Key Features
- Comprehensive Historical Data: Arrow Electronics’ past financial reports and pre-populated forecasts.
- Customizable Parameters: Modify WACC, tax rates, revenue growth, and EBITDA margins to fit your analysis.
- Real-Time Valuation: Observe Arrow Electronics’ intrinsic value update instantly.
- Intuitive Visual Representations: Dashboard graphs illustrate valuation outcomes and essential metrics.
- Designed for Precision: A reliable tool tailored for analysts, investors, and finance professionals.
How It Works
- Download: Obtain the pre-built Excel file featuring Arrow Electronics, Inc. (ARW) financial data.
- Customize: Modify projections such as revenue growth, EBITDA %, and WACC as needed.
- Update Automatically: Watch as the intrinsic value and NPV calculations refresh in real-time.
- Test Scenarios: Develop various forecasts and instantly compare the results.
- Make Decisions: Leverage the valuation outcomes to inform your investment strategy.
Why Choose Arrow Electronics, Inc. (ARW)?
- Streamlined Solutions: Access ready-to-use tools without the hassle of starting from scratch.
- Enhanced Precision: Dependable data and methodologies minimize valuation errors.
- Completely Adaptable: Customize the platform to align with your specific needs and forecasts.
- User-Friendly Insights: Intuitive visualizations and outputs simplify data interpretation.
- Industry Endorsed: Crafted for professionals who prioritize accuracy and efficiency.
Who Should Use This Product?
- Investors: Accurately estimate Arrow Electronics, Inc.'s (ARW) fair value before making investment decisions.
- CFOs: Leverage a professional-grade DCF model for financial reporting and analysis at Arrow Electronics, Inc. (ARW).
- Consultants: Quickly adapt the template for valuation reports tailored for Arrow Electronics, Inc. (ARW) clients.
- Entrepreneurs: Gain insights into financial modeling practices employed by leading companies like Arrow Electronics, Inc. (ARW).
- Educators: Use it as a teaching tool to illustrate valuation methodologies relevant to Arrow Electronics, Inc. (ARW).
What the Template Contains
- Preloaded ARW Data: Historical and projected financial data, including revenue, EBIT, and capital expenditures.
- DCF and WACC Models: Professional-grade sheets for calculating intrinsic value and Weighted Average Cost of Capital.
- Editable Inputs: Yellow-highlighted cells for adjusting revenue growth, tax rates, and discount rates.
- Financial Statements: Comprehensive annual and quarterly financials for deeper analysis.
- Key Ratios: Profitability, leverage, and efficiency ratios to evaluate performance.
- Dashboard and Charts: Visual summaries of valuation outcomes and assumptions.
Disclaimer
All information, articles, and product details provided on this website are for general informational and educational purposes only. We do not claim any ownership over, nor do we intend to infringe upon, any trademarks, copyrights, logos, brand names, or other intellectual property mentioned or depicted on this site. Such intellectual property remains the property of its respective owners, and any references here are made solely for identification or informational purposes, without implying any affiliation, endorsement, or partnership.
We make no representations or warranties, express or implied, regarding the accuracy, completeness, or suitability of any content or products presented. Nothing on this website should be construed as legal, tax, investment, financial, medical, or other professional advice. In addition, no part of this site—including articles or product references—constitutes a solicitation, recommendation, endorsement, advertisement, or offer to buy or sell any securities, franchises, or other financial instruments, particularly in jurisdictions where such activity would be unlawful.
All content is of a general nature and may not address the specific circumstances of any individual or entity. It is not a substitute for professional advice or services. Any actions you take based on the information provided here are strictly at your own risk. You accept full responsibility for any decisions or outcomes arising from your use of this website and agree to release us from any liability in connection with your use of, or reliance upon, the content or products found herein.