
|
Asahi India Glass Limited (Asahiindia.NS) DCF -Bewertung |
Fully Editable: Tailor To Your Needs In Excel Or Sheets
Professional Design: Trusted, Industry-Standard Templates
Investor-Approved Valuation Models
MAC/PC Compatible, Fully Unlocked
No Expertise Is Needed; Easy To Follow
Asahi India Glass Limited (ASAHIINDIA.NS) Bundle
Unser (Asahiindians) DCF-Taschenrechner wurde für die Genauigkeit entwickelt und ermöglicht es Ihnen, die Bewertung von Asahi India Glass Limited unter Verwendung realer Finanzdaten zu bewerten und vollständige Flexibilität zu bieten, um alle wesentlichen Parameter für verbesserte Projektionen zu ändern.
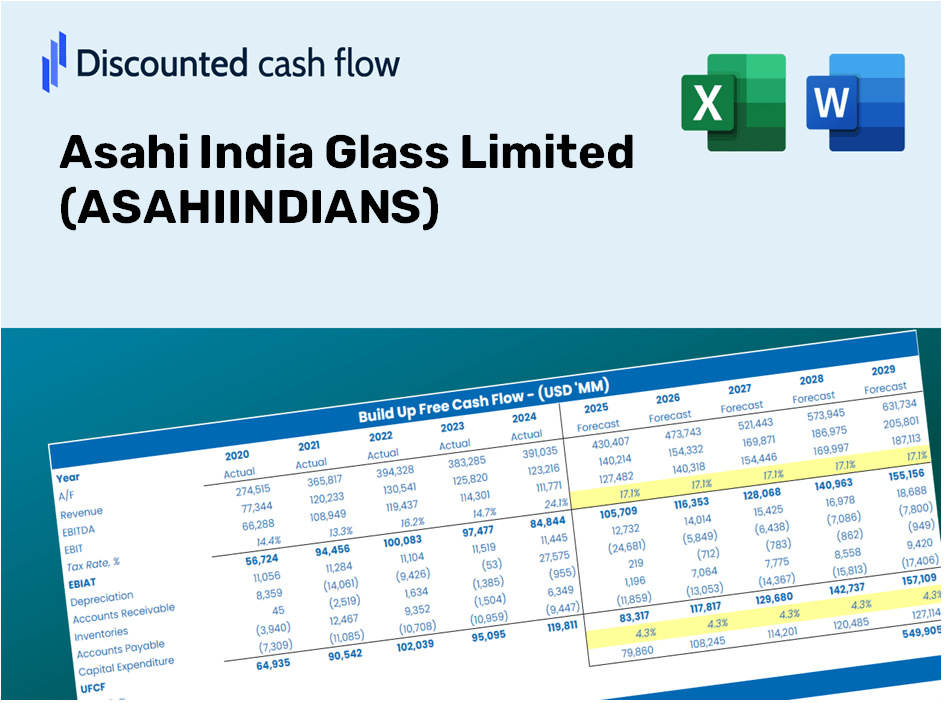
Discounted Cash Flow (DCF) - (USD MM)
| Year | AY1 2021 |
AY2 2022 |
AY3 2023 |
AY4 2024 |
AY5 2025 |
FY1 2026 |
FY2 2027 |
FY3 2028 |
FY4 2029 |
FY5 2030 |
|---|---|---|---|---|---|---|---|---|---|---|
| Revenue | 24,212.1 | 31,704.1 | 40,187.6 | 43,405.9 | 45,942.5 | 54,160.9 | 63,849.4 | 75,271.1 | 88,735.9 | 104,609.3 |
| Revenue Growth, % | 0 | 30.94 | 26.76 | 8.01 | 5.84 | 17.89 | 17.89 | 17.89 | 17.89 | 17.89 |
| EBITDA | 4,240.9 | 7,515.6 | 8,007.9 | 7,078.6 | 7,429.6 | 10,141.8 | 11,956.0 | 14,094.8 | 16,616.1 | 19,588.5 |
| EBITDA, % | 17.52 | 23.71 | 19.93 | 16.31 | 16.17 | 18.73 | 18.73 | 18.73 | 18.73 | 18.73 |
| Depreciation | 1,217.6 | 1,489.9 | 1,487.9 | 1,644.5 | 1,677.6 | 2,260.8 | 2,665.2 | 3,141.9 | 3,704.0 | 4,366.6 |
| Depreciation, % | 5.03 | 4.7 | 3.7 | 3.79 | 3.65 | 4.17 | 4.17 | 4.17 | 4.17 | 4.17 |
| EBIT | 3,023.3 | 6,025.7 | 6,520.0 | 5,434.1 | 5,752.0 | 7,881.1 | 9,290.9 | 10,952.8 | 12,912.1 | 15,221.9 |
| EBIT, % | 12.49 | 19.01 | 16.22 | 12.52 | 12.52 | 14.55 | 14.55 | 14.55 | 14.55 | 14.55 |
| Total Cash | 582.0 | 879.0 | 1,183.7 | 1,786.2 | 1,707.0 | 1,728.0 | 2,037.1 | 2,401.5 | 2,831.1 | 3,337.5 |
| Total Cash, percent | .0 | .0 | .0 | .0 | .0 | .0 | .0 | .0 | .0 | .0 |
| Account Receivables | 2,734.4 | 2,595.0 | 3,532.3 | 3,535.0 | 4,734.3 | 5,060.5 | 5,965.7 | 7,032.9 | 8,290.9 | 9,774.1 |
| Account Receivables, % | 11.29 | 8.19 | 8.79 | 8.14 | 10.3 | 9.34 | 9.34 | 9.34 | 9.34 | 9.34 |
| Inventories | 7,249.6 | 8,076.0 | 11,625.2 | 10,605.9 | 11,194.0 | 14,422.2 | 17,002.1 | 20,043.5 | 23,628.9 | 27,855.8 |
| Inventories, % | 29.94 | 25.47 | 28.93 | 24.43 | 24.37 | 26.63 | 26.63 | 26.63 | 26.63 | 26.63 |
| Accounts Payable | 6,392.4 | 6,181.2 | 8,523.2 | 1,524.3 | 10,053.6 | 10,019.9 | 11,812.3 | 13,925.4 | 16,416.4 | 19,353.0 |
| Accounts Payable, % | 26.4 | 19.5 | 21.21 | 3.51 | 21.88 | 18.5 | 18.5 | 18.5 | 18.5 | 18.5 |
| Capital Expenditure | -1,044.9 | -1,014.1 | -3,248.1 | -9,010.9 | -12,679.8 | -6,927.8 | -8,167.0 | -9,628.0 | -11,350.3 | -13,380.7 |
| Capital Expenditure, % | -4.32 | -3.2 | -8.08 | -20.76 | -27.6 | -12.79 | -12.79 | -12.79 | -12.79 | -12.79 |
| Tax Rate, % | 27.6 | 27.6 | 27.6 | 27.6 | 27.6 | 27.6 | 27.6 | 27.6 | 27.6 | 27.6 |
| EBITAT | 1,963.8 | 4,067.9 | 4,223.1 | 4,027.1 | 4,164.7 | 5,418.2 | 6,387.5 | 7,530.1 | 8,877.1 | 10,465.1 |
| Depreciation | ||||||||||
| Changes in Account Receivables | ||||||||||
| Changes in Inventories | ||||||||||
| Changes in Accounts Payable | ||||||||||
| Capital Expenditure | ||||||||||
| UFCF | -1,455.1 | 3,645.5 | 318.4 | -9,321.6 | -95.6 | -2,836.8 | -807.1 | -951.5 | -1,121.7 | -1,322.3 |
| WACC, % | 4.78 | 4.79 | 4.78 | 4.82 | 4.82 | 4.8 | 4.8 | 4.8 | 4.8 | 4.8 |
| PV UFCF | ||||||||||
| SUM PV UFCF | -6,244.6 | |||||||||
| Long Term Growth Rate, % | 4.00 | |||||||||
| Free cash flow (T + 1) | -1,375 | |||||||||
| Terminal Value | -172,355 | |||||||||
| Present Terminal Value | -136,352 | |||||||||
| Enterprise Value | -142,596 | |||||||||
| Net Debt | 25,313 | |||||||||
| Equity Value | -167,909 | |||||||||
| Diluted Shares Outstanding, MM | 243 | |||||||||
| Equity Value Per Share | -690.73 |
What You Will Receive
- Flexible Forecast Inputs: Adjust key assumptions (growth %, margins, WACC) effortlessly to create various scenarios.
- Real-World Data: Asahi India Glass Limited’s (ASAHIINDIANS) financial data pre-filled to accelerate your analysis.
- Automated DCF Outputs: The template computes Net Present Value (NPV) and intrinsic value automatically.
- Customizable and Professional: A refined Excel model tailored to meet your valuation requirements.
- Designed for Analysts and Investors: Perfect for evaluating projections, confirming strategies, and enhancing efficiency.
Key Features
- Comprehensive DCF Calculator: Offers detailed unlevered and levered DCF valuation models tailored for Asahi India Glass Limited (ASAHIINDIANS).
- WACC Calculator: Features a pre-built Weighted Average Cost of Capital sheet with customizable input options.
- Adjustable Forecast Assumptions: Easily modify growth rates, capital expenditures, and discount rates according to your analysis needs.
- Integrated Financial Ratios: Evaluate profitability, leverage, and efficiency ratios specific to Asahi India Glass Limited (ASAHIINDIANS).
- Visualization Dashboard and Charts: Provides visual summaries of key valuation metrics for straightforward analysis.
How It Functions
- Step 1: Download the Excel file.
- Step 2: Examine Asahi India Glass Limited’s pre-filled financial data and projections.
- Step 3: Adjust key inputs such as revenue growth, WACC, and tax rates (highlighted cells).
- Step 4: Observe the DCF model update in real-time as you modify your assumptions.
- Step 5: Evaluate the results and leverage the insights for your investment choices.
Why Choose the ASAHIINDIANS Calculator?
- Save Time: Skip the hassle of building a DCF model from the ground up – it's ready for immediate use.
- Enhance Accuracy: Utilize dependable financial data and formulas to minimize valuation errors.
- Completely Customizable: Adjust the model to align with your specific assumptions and forecasts.
- User-Friendly: Intuitive charts and outputs ensure the results are straightforward to understand.
- Endorsed by Professionals: Crafted for those who prioritize precision and efficiency in their analyses.
Who Can Benefit from Asahi India Glass Limited (ASAHIINDIANS)?
- Investors: Make informed investment choices with a reliable valuation tool from Asahi India Glass Limited (ASAHIINDIANS).
- Financial Analysts: Increase efficiency with a ready-to-customize DCF model provided by Asahi India Glass Limited (ASAHIINDIANS).
- Consultants: Quickly modify the template for impactful presentations or client reports related to Asahi India Glass Limited (ASAHIINDIANS).
- Finance Enthusiasts: Enhance your grasp of valuation methods through practical examples related to Asahi India Glass Limited (ASAHIINDIANS).
- Educators and Students: Utilize Asahi India Glass Limited (ASAHIINDIANS) as a hands-on learning resource in finance courses.
What the Template Includes
- Historical Data: Contains past financial information and baseline forecasts for Asahi India Glass Limited (ASAHIINDIANS).
- DCF and Levered DCF Models: Comprehensive templates designed to determine the intrinsic value of Asahi India Glass Limited (ASAHIINDIANS).
- WACC Sheet: Built-in calculations for Weighted Average Cost of Capital tailored for Asahi India Glass Limited (ASAHIINDIANS).
- Editable Inputs: Customize essential drivers such as growth rates, EBITDA percentages, and CAPEX assumptions.
- Quarterly and Annual Statements: A thorough analysis of the financials of Asahi India Glass Limited (ASAHIINDIANS).
- Interactive Dashboard: A dynamic interface to visualize valuation results and future projections.
Disclaimer
All information, articles, and product details provided on this website are for general informational and educational purposes only. We do not claim any ownership over, nor do we intend to infringe upon, any trademarks, copyrights, logos, brand names, or other intellectual property mentioned or depicted on this site. Such intellectual property remains the property of its respective owners, and any references here are made solely for identification or informational purposes, without implying any affiliation, endorsement, or partnership.
We make no representations or warranties, express or implied, regarding the accuracy, completeness, or suitability of any content or products presented. Nothing on this website should be construed as legal, tax, investment, financial, medical, or other professional advice. In addition, no part of this site—including articles or product references—constitutes a solicitation, recommendation, endorsement, advertisement, or offer to buy or sell any securities, franchises, or other financial instruments, particularly in jurisdictions where such activity would be unlawful.
All content is of a general nature and may not address the specific circumstances of any individual or entity. It is not a substitute for professional advice or services. Any actions you take based on the information provided here are strictly at your own risk. You accept full responsibility for any decisions or outcomes arising from your use of this website and agree to release us from any liability in connection with your use of, or reliance upon, the content or products found herein.