
|
Ascendis Pharma A/S (ASND) DCF -Bewertung |
Fully Editable: Tailor To Your Needs In Excel Or Sheets
Professional Design: Trusted, Industry-Standard Templates
Investor-Approved Valuation Models
MAC/PC Compatible, Fully Unlocked
No Expertise Is Needed; Easy To Follow
Ascendis Pharma A/S (ASND) Bundle
Bewerten Sie die finanziellen Aussichten von Ascendis Pharma A/S wie ein Experte! Dieser (ASND) DCF-Taschenrechner verfügt über vorinstallierte Finanzdaten und bietet eine vollständige Flexibilität, um das Umsatzwachstum, WACC, Margen und andere kritische Annahmen zu ändern, um sich an Ihren Projektionen anzupassen.
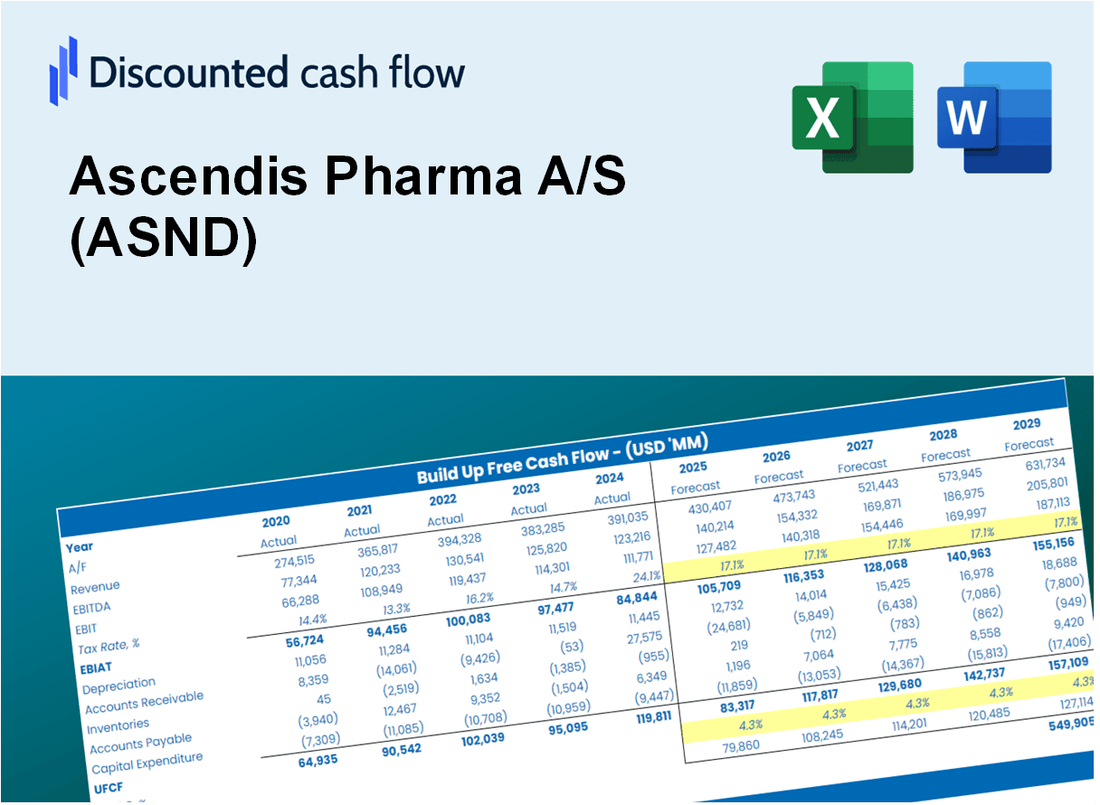
Discounted Cash Flow (DCF) - (USD MM)
| Year | AY1 2020 |
AY2 2021 |
AY3 2022 |
AY4 2023 |
AY5 2024 |
FY1 2025 |
FY2 2026 |
FY3 2027 |
FY4 2028 |
FY5 2029 |
|---|---|---|---|---|---|---|---|---|---|---|
| Revenue | 8.1 | 9.0 | 59.3 | 308.9 | 421.1 | 682.4 | 1,105.9 | 1,792.1 | 2,904.1 | 4,706.2 |
| Revenue Growth, % | 0 | 11.87 | 557.93 | 421.2 | 36.34 | 62.05 | 62.05 | 62.05 | 62.05 | 62.05 |
| EBITDA | -472.3 | -422.3 | -612.8 | -476.2 | -335.9 | -654.8 | -1,061.1 | -1,719.6 | -2,786.6 | -4,515.7 |
| EBITDA, % | -5865.21 | -4688.12 | -1034.07 | -154.16 | -79.76 | -95.95 | -95.95 | -95.95 | -95.95 | -95.95 |
| Depreciation | 10.9 | 17.8 | 20.3 | 21.9 | 20.5 | 336.0 | 544.5 | 882.4 | 1,429.9 | 2,317.2 |
| Depreciation, % | 135.88 | 197.88 | 34.22 | 7.09 | 4.87 | 49.24 | 49.24 | 49.24 | 49.24 | 49.24 |
| EBIT | -483.2 | -440.1 | -633.1 | -498.1 | -356.4 | -661.5 | -1,071.9 | -1,737.0 | -2,814.9 | -4,561.5 |
| EBIT, % | -6001.09 | -4886 | -1068.3 | -161.25 | -84.63 | -96.93 | -96.93 | -96.93 | -96.93 | -96.93 |
| Total Cash | 832.4 | 789.9 | 851.7 | 462.6 | 648.0 | 682.4 | 1,105.9 | 1,792.1 | 2,904.1 | 4,706.2 |
| Total Cash, percent | .0 | .0 | .0 | .0 | .0 | .0 | .0 | .0 | .0 | .0 |
| Account Receivables | .4 | 2.5 | 13.8 | 41.5 | 192.6 | 158.7 | 257.2 | 416.9 | 675.5 | 1,094.7 |
| Account Receivables, % | 5.57 | 28.28 | 23.27 | 13.45 | 45.73 | 23.26 | 23.26 | 23.26 | 23.26 | 23.26 |
| Inventories | .0 | 87.3 | 151.3 | 242.0 | 342.3 | 490.8 | 795.4 | 1,289.0 | 2,088.8 | 3,384.9 |
| Inventories, % | 0 | 969.47 | 255.35 | 78.33 | 81.29 | 71.93 | 71.93 | 71.93 | 71.93 | 71.93 |
| Accounts Payable | 25.4 | 68.8 | 117.0 | 109.5 | 111.6 | 494.0 | 800.6 | 1,297.4 | 2,102.4 | 3,406.9 |
| Accounts Payable, % | 314.93 | 763.91 | 197.43 | 35.46 | 26.51 | 72.39 | 72.39 | 72.39 | 72.39 | 72.39 |
| Capital Expenditure | -25.0 | -28.1 | -16.8 | -2.8 | -1.7 | -313.4 | -507.9 | -823.0 | -1,333.7 | -2,161.3 |
| Capital Expenditure, % | -309.97 | -311.57 | -28.31 | -0.91557 | -0.39242 | -45.92 | -45.92 | -45.92 | -45.92 | -45.92 |
| Tax Rate, % | -1.3 | -1.3 | -1.3 | -1.3 | -1.3 | -1.3 | -1.3 | -1.3 | -1.3 | -1.3 |
| EBITAT | -483.0 | -439.7 | -639.0 | -505.7 | -361.0 | -661.3 | -1,071.6 | -1,736.5 | -2,814.0 | -4,560.2 |
| Depreciation | ||||||||||
| Changes in Account Receivables | ||||||||||
| Changes in Inventories | ||||||||||
| Changes in Accounts Payable | ||||||||||
| Capital Expenditure | ||||||||||
| UFCF | -472.1 | -495.9 | -662.6 | -612.5 | -591.4 | -370.9 | -1,131.5 | -1,833.5 | -2,971.3 | -4,815.0 |
| WACC, % | 5.99 | 5.99 | 5.99 | 5.99 | 5.99 | 5.99 | 5.99 | 5.99 | 5.99 | 5.99 |
| PV UFCF | ||||||||||
| SUM PV UFCF | -8,850.2 | |||||||||
| Long Term Growth Rate, % | 2.00 | |||||||||
| Free cash flow (T + 1) | -4,911 | |||||||||
| Terminal Value | -122,997 | |||||||||
| Present Terminal Value | -91,940 | |||||||||
| Enterprise Value | -100,791 | |||||||||
| Net Debt | 344 | |||||||||
| Equity Value | -101,135 | |||||||||
| Diluted Shares Outstanding, MM | 58 | |||||||||
| Equity Value Per Share | -1,746.97 |
What You Will Receive
- Pre-Filled Financial Model: Ascendis Pharma A/S's actual data facilitates accurate DCF valuation.
- Comprehensive Forecast Control: Modify revenue growth, profit margins, WACC, and other essential drivers.
- Real-Time Calculations: Automatic updates allow you to view results instantly as you make adjustments.
- Investor-Ready Template: A polished Excel file crafted for high-quality valuation presentations.
- Customizable and Reusable: Designed for adaptability, enabling repeated use for in-depth forecasts.
Key Features
- Comprehensive Financial Data: Ascendis Pharma A/S's (ASND) historical financial statements and pre-filled projections.
- Customizable Parameters: Adjust WACC, tax rates, revenue growth, and EBITDA margins to fit your analysis.
- Real-Time Insights: Monitor Ascendis Pharma A/S's (ASND) intrinsic value as it recalculates instantly.
- Intuitive Visualizations: Dashboard charts illustrate valuation outcomes and essential metrics clearly.
- Designed for Precision: A professional-grade tool tailored for analysts, investors, and finance professionals.
How It Works
- Download the Template: Gain immediate access to the Excel-based ASND DCF Calculator.
- Input Your Assumptions: Modify the yellow-highlighted cells for growth rates, WACC, margins, and other key variables.
- Instant Calculations: The model automatically recalculates Ascendis Pharma’s intrinsic value.
- Test Scenarios: Experiment with various assumptions to see how they impact valuation outcomes.
- Analyze and Decide: Utilize the findings to inform your investment or financial assessment.
Why Choose This Calculator for Ascendis Pharma A/S (ASND)?
- Accurate Data: Up-to-date Ascendis Pharma financials provide dependable valuation insights.
- Customizable: Tailor key inputs such as growth rates, WACC, and tax rates to fit your forecasts.
- Time-Saving: Pre-configured calculations save you the hassle of starting from the ground up.
- Professional-Grade Tool: Crafted for investors, analysts, and consultants in the biotech sector.
- User-Friendly: Easy-to-navigate design and clear instructions cater to users of all experience levels.
Who Should Use This Product?
- Investors: Accurately assess Ascendis Pharma A/S’s (ASND) fair value prior to making investment choices.
- CFOs: Utilize a high-quality DCF model for financial reporting and analysis related to Ascendis Pharma A/S (ASND).
- Consultants: Easily customize the template for valuation reports tailored to clients interested in Ascendis Pharma A/S (ASND).
- Entrepreneurs: Acquire knowledge about financial modeling practices employed by leading biotech firms like Ascendis Pharma A/S (ASND).
- Educators: Implement it as a teaching resource to illustrate valuation techniques applicable to companies like Ascendis Pharma A/S (ASND).
What the Template Contains
- Historical Data: Includes Ascendis Pharma A/S’s past financials and baseline forecasts.
- DCF and Levered DCF Models: Detailed templates to calculate Ascendis Pharma A/S’s intrinsic value.
- WACC Sheet: Pre-built calculations for Weighted Average Cost of Capital.
- Editable Inputs: Modify key drivers like growth rates, EBITDA %, and CAPEX assumptions.
- Quarterly and Annual Statements: A complete breakdown of Ascendis Pharma A/S’s financials.
- Interactive Dashboard: Visualize valuation results and projections dynamically.
Disclaimer
All information, articles, and product details provided on this website are for general informational and educational purposes only. We do not claim any ownership over, nor do we intend to infringe upon, any trademarks, copyrights, logos, brand names, or other intellectual property mentioned or depicted on this site. Such intellectual property remains the property of its respective owners, and any references here are made solely for identification or informational purposes, without implying any affiliation, endorsement, or partnership.
We make no representations or warranties, express or implied, regarding the accuracy, completeness, or suitability of any content or products presented. Nothing on this website should be construed as legal, tax, investment, financial, medical, or other professional advice. In addition, no part of this site—including articles or product references—constitutes a solicitation, recommendation, endorsement, advertisement, or offer to buy or sell any securities, franchises, or other financial instruments, particularly in jurisdictions where such activity would be unlawful.
All content is of a general nature and may not address the specific circumstances of any individual or entity. It is not a substitute for professional advice or services. Any actions you take based on the information provided here are strictly at your own risk. You accept full responsibility for any decisions or outcomes arising from your use of this website and agree to release us from any liability in connection with your use of, or reliance upon, the content or products found herein.