
|
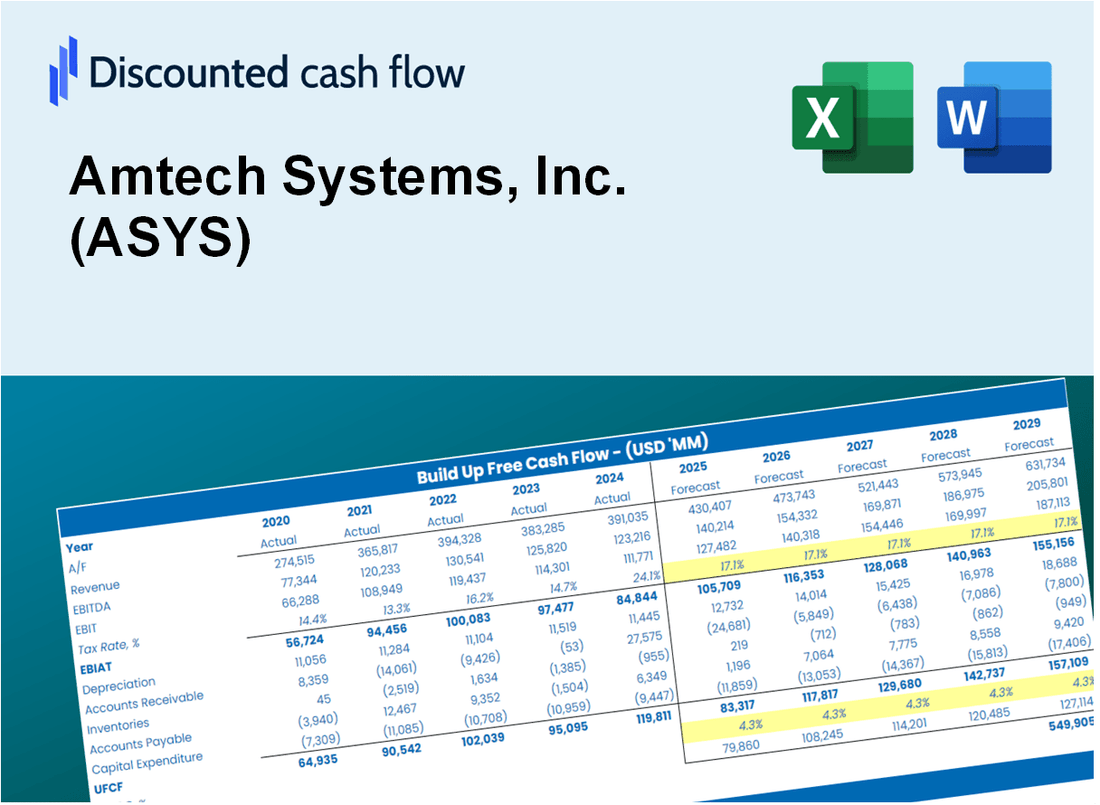
Amtech Systems, Inc. (ASYS) DCF -Bewertung |
Fully Editable: Tailor To Your Needs In Excel Or Sheets
Professional Design: Trusted, Industry-Standard Templates
Investor-Approved Valuation Models
MAC/PC Compatible, Fully Unlocked
No Expertise Is Needed; Easy To Follow
Amtech Systems, Inc. (ASYS) Bundle
Verbessern Sie Ihre Anlagestrategien mit dem DCF -Taschenrechner von Amtech Systems, Inc. (ASYS)! Verwenden Sie authentische Finanzdaten, passen Sie Wachstumsprojektionen und -kosten an und beobachten Sie sofort, wie sich diese Veränderungen auf den inneren Wert von Amtech Systems, Inc. (ASYS) auswirken.
What You Will Get
- Real ASYS Financials: Access to historical and projected data for precise valuation.
- Customizable Inputs: Adjust WACC, tax rates, revenue growth, and capital expenditures as needed.
- Dynamic Calculations: Intrinsic value and NPV are computed automatically.
- Scenario Analysis: Evaluate various scenarios to assess Amtech's future performance.
- User-Friendly Interface: Designed for professionals but easy for newcomers to navigate.
Key Features
- Pre-Loaded Data: Amtech Systems, Inc.'s historical financial statements and pre-filled forecasts.
- Fully Adjustable Inputs: Modify WACC, tax rates, revenue growth, and EBITDA margins.
- Instant Results: View Amtech Systems, Inc.'s intrinsic value recalculating in real time.
- Clear Visual Outputs: Dashboard charts illustrate valuation results and key metrics.
- Built for Accuracy: A professional tool designed for analysts, investors, and finance experts.
How It Works
- Step 1: Download the Excel file for Amtech Systems, Inc. (ASYS).
- Step 2: Review the pre-filled financial data and forecasts for Amtech Systems.
- Step 3: Modify key inputs such as revenue growth, WACC, and tax rates (highlighted cells).
- Step 4: Observe the DCF model update in real-time as you adjust your assumptions.
- Step 5: Analyze the outputs and leverage the results for your investment decisions regarding Amtech Systems, Inc. (ASYS).
Why Choose Amtech Systems, Inc. (ASYS)?
- Save Time: Quickly access pre-built models without starting from scratch.
- Enhance Accuracy: Utilize dependable financial data and formulas to minimize valuation errors.
- Fully Customizable: Adjust the model to align with your specific assumptions and forecasts.
- Easy to Understand: Intuitive charts and outputs simplify the analysis of results.
- Preferred by Professionals: Crafted for experts who prioritize precision and functionality.
Who Should Use This Product?
- Individual Investors: Make informed decisions about buying or selling Amtech Systems, Inc. (ASYS) stock.
- Financial Analysts: Streamline valuation processes with ready-to-use financial models for Amtech Systems, Inc. (ASYS).
- Consultants: Deliver professional valuation insights on Amtech Systems, Inc. (ASYS) to clients quickly and accurately.
- Business Owners: Understand how companies like Amtech Systems, Inc. (ASYS) are valued to guide your own strategy.
- Finance Students: Learn valuation techniques using real-world data and scenarios related to Amtech Systems, Inc. (ASYS).
What the Template Contains
- Pre-Filled Data: Includes Amtech Systems, Inc. (ASYS) historical financials and projections.
- Discounted Cash Flow Model: Editable DCF valuation model with automatic calculations.
- Weighted Average Cost of Capital (WACC): A dedicated sheet for calculating WACC based on custom inputs.
- Key Financial Ratios: Analyze Amtech Systems, Inc. (ASYS) profitability, efficiency, and leverage.
- Customizable Inputs: Edit revenue growth, margins, and tax rates with ease.
- Clear Dashboard: Charts and tables summarizing key valuation results.
Disclaimer
All information, articles, and product details provided on this website are for general informational and educational purposes only. We do not claim any ownership over, nor do we intend to infringe upon, any trademarks, copyrights, logos, brand names, or other intellectual property mentioned or depicted on this site. Such intellectual property remains the property of its respective owners, and any references here are made solely for identification or informational purposes, without implying any affiliation, endorsement, or partnership.
We make no representations or warranties, express or implied, regarding the accuracy, completeness, or suitability of any content or products presented. Nothing on this website should be construed as legal, tax, investment, financial, medical, or other professional advice. In addition, no part of this site—including articles or product references—constitutes a solicitation, recommendation, endorsement, advertisement, or offer to buy or sell any securities, franchises, or other financial instruments, particularly in jurisdictions where such activity would be unlawful.
All content is of a general nature and may not address the specific circumstances of any individual or entity. It is not a substitute for professional advice or services. Any actions you take based on the information provided here are strictly at your own risk. You accept full responsibility for any decisions or outcomes arising from your use of this website and agree to release us from any liability in connection with your use of, or reliance upon, the content or products found herein.