
|
Aterian, Inc. (Ater) DCF -Bewertung |
Fully Editable: Tailor To Your Needs In Excel Or Sheets
Professional Design: Trusted, Industry-Standard Templates
Investor-Approved Valuation Models
MAC/PC Compatible, Fully Unlocked
No Expertise Is Needed; Easy To Follow
Aterian, Inc. (ATER) Bundle
Gewinnen Sie einen Einblick in Ihre Aterian, Inc. (Ater) Bewertungsanalyse mit unserem ausgefeilten DCF -Taschenrechner! Diese Excel -Vorlage mit authentischen Aterian, Inc. (Ater) -Daten (Ater) ermöglicht es Ihnen, die Vorhersagen und Annahmen anzupassen, um den intrinsischen Wert von Aterian, Inc. (Ater) genau zu bestimmen.
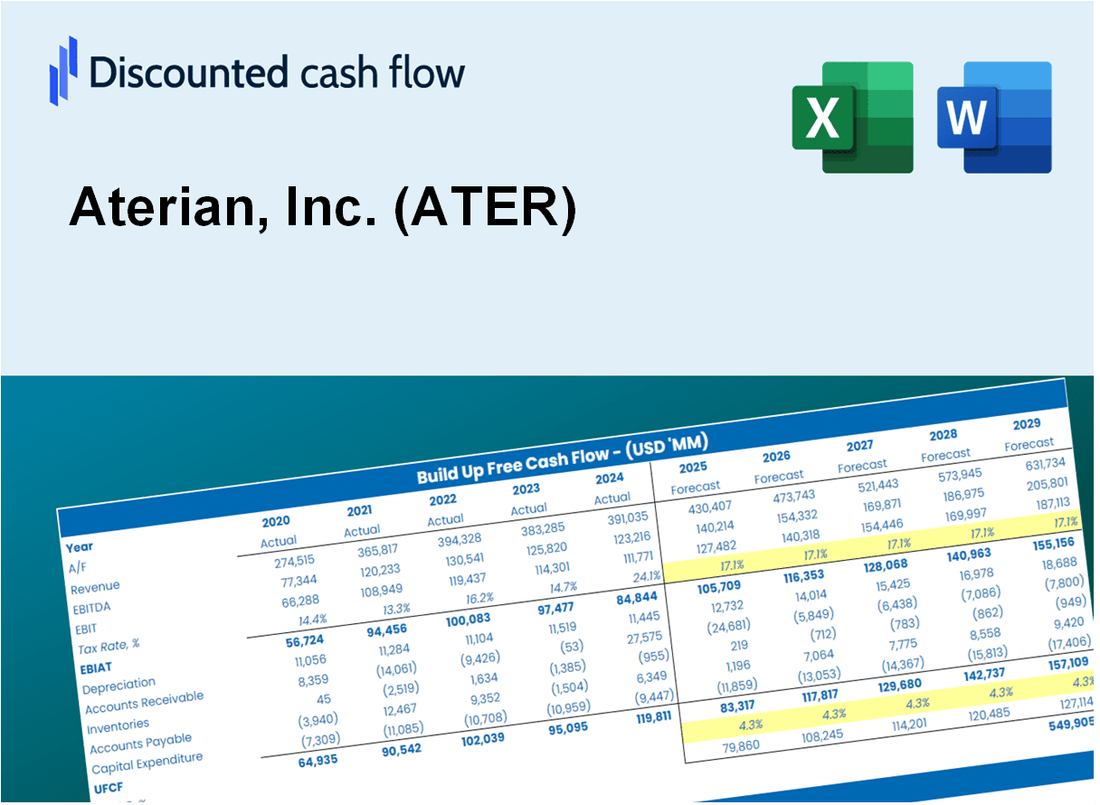
Discounted Cash Flow (DCF) - (USD MM)
| Year | AY1 2020 |
AY2 2021 |
AY3 2022 |
AY4 2023 |
AY5 2024 |
FY1 2025 |
FY2 2026 |
FY3 2027 |
FY4 2028 |
FY5 2029 |
|---|---|---|---|---|---|---|---|---|---|---|
| Revenue | 185.7 | 247.8 | 221.2 | 142.6 | 99.0 | 88.3 | 78.7 | 70.2 | 62.6 | 55.8 |
| Revenue Growth, % | 0 | 33.42 | -10.73 | -35.54 | -30.53 | -10.85 | -10.85 | -10.85 | -10.85 | -10.85 |
| EBITDA | -57.5 | -214.9 | -186.5 | -69.4 | -9.0 | -45.9 | -40.9 | -36.5 | -32.5 | -29.0 |
| EBITDA, % | -30.96 | -86.74 | -84.3 | -48.69 | -9.09 | -51.96 | -51.96 | -51.96 | -51.96 | -51.96 |
| Depreciation | .6 | 7.3 | 7.5 | 3.9 | 1.7 | 2.0 | 1.7 | 1.6 | 1.4 | 1.2 |
| Depreciation, % | 0.29725 | 2.96 | 3.4 | 2.73 | 1.71 | 2.22 | 2.22 | 2.22 | 2.22 | 2.22 |
| EBIT | -58.0 | -222.2 | -194.0 | -73.3 | -10.7 | -47.8 | -42.6 | -38.0 | -33.9 | -30.2 |
| EBIT, % | -31.25 | -89.7 | -87.7 | -51.42 | -10.79 | -54.17 | -54.17 | -54.17 | -54.17 | -54.17 |
| Total Cash | 26.7 | 30.3 | 43.6 | 20.0 | 18.0 | 13.9 | 12.4 | 11.0 | 9.8 | 8.8 |
| Total Cash, percent | .0 | .0 | .0 | .0 | .0 | .0 | .0 | .0 | .0 | .0 |
| Account Receivables | 5.7 | 10.5 | 4.5 | 4.2 | 3.8 | 2.9 | 2.5 | 2.3 | 2.0 | 1.8 |
| Account Receivables, % | 3.09 | 4.23 | 2.04 | 2.96 | 3.82 | 3.23 | 3.23 | 3.23 | 3.23 | 3.23 |
| Inventories | 31.6 | 63.0 | 43.7 | 20.4 | 13.7 | 16.0 | 14.2 | 12.7 | 11.3 | 10.1 |
| Inventories, % | 17.01 | 25.45 | 19.74 | 14.3 | 13.88 | 18.08 | 18.08 | 18.08 | 18.08 | 18.08 |
| Accounts Payable | 14.9 | 21.7 | 16.0 | 4.2 | 3.1 | 5.3 | 4.7 | 4.2 | 3.8 | 3.4 |
| Accounts Payable, % | 8 | 8.76 | 7.25 | 2.94 | 3.11 | 6.01 | 6.01 | 6.01 | 6.01 | 6.01 |
| Capital Expenditure | -.1 | .0 | -.1 | -.1 | .0 | .0 | .0 | .0 | .0 | .0 |
| Capital Expenditure, % | -0.04792573 | -0.01291536 | -0.03707555 | -0.08347011 | -0.04240497 | -0.04475834 | -0.04475834 | -0.04475834 | -0.04475834 | -0.04475834 |
| Tax Rate, % | 0.39466 | 0.39466 | 0.39466 | 0.39466 | 0.39466 | 0.39466 | 0.39466 | 0.39466 | 0.39466 | 0.39466 |
| EBITAT | -58.1 | -222.7 | -193.6 | -72.5 | -10.6 | -47.7 | -42.5 | -37.9 | -33.8 | -30.1 |
| Depreciation | ||||||||||
| Changes in Account Receivables | ||||||||||
| Changes in Inventories | ||||||||||
| Changes in Accounts Payable | ||||||||||
| Capital Expenditure | ||||||||||
| UFCF | -80.1 | -244.8 | -166.5 | -57.0 | -3.0 | -44.8 | -39.3 | -35.1 | -31.3 | -27.9 |
| WACC, % | 11.53 | 11.53 | 11.51 | 11.43 | 11.5 | 11.5 | 11.5 | 11.5 | 11.5 | 11.5 |
| PV UFCF | ||||||||||
| SUM PV UFCF | -133.5 | |||||||||
| Long Term Growth Rate, % | 2.00 | |||||||||
| Free cash flow (T + 1) | -28 | |||||||||
| Terminal Value | -299 | |||||||||
| Present Terminal Value | -174 | |||||||||
| Enterprise Value | -307 | |||||||||
| Net Debt | -11 | |||||||||
| Equity Value | -297 | |||||||||
| Diluted Shares Outstanding, MM | 7 | |||||||||
| Equity Value Per Share | -41.95 |
What You Will Get
- Genuine ATER Financial Data: Pre-filled with Aterian’s historical and projected data for precise analysis.
- Fully Customizable Template: Easily adjust key inputs like revenue growth, WACC, and EBITDA %.
- Instant Calculations: Watch Aterian’s intrinsic value update in real-time based on your modifications.
- Professional Valuation Tool: Crafted for investors, analysts, and consultants aiming for accurate DCF results.
- User-Friendly Interface: Intuitive layout and clear guidance suitable for all experience levels.
Key Features
- Accurate Aterian Financials: Gain access to reliable pre-loaded historical data and future forecasts.
- Adjustable Forecast Inputs: Modify highlighted cells for metrics such as WACC, growth rates, and profit margins.
- Real-Time Calculations: Instant updates to DCF, Net Present Value (NPV), and cash flow evaluations.
- Interactive Dashboard: User-friendly charts and summaries to help you visualize your valuation outcomes.
- Suitable for All Levels: An easy-to-navigate layout designed for investors, CFOs, and consultants alike.
How It Works
- Step 1: Download the prebuilt Excel template featuring Aterian, Inc.'s (ATER) data.
- Step 2: Review the pre-filled sheets to familiarize yourself with the key performance indicators.
- Step 3: Adjust forecasts and assumptions in the editable yellow cells (WACC, growth, margins).
- Step 4: Instantly see the updated results, including Aterian, Inc.'s (ATER) intrinsic value.
- Step 5: Use the outputs to make informed investment decisions or create detailed reports.
Why Choose Aterian, Inc. (ATER) Calculator?
- All-in-One Solution: Combines DCF, WACC, and financial ratio analyses tailored for Aterian, Inc. (ATER).
- Flexible Inputs: Modify yellow-highlighted fields to explore different financial scenarios.
- In-Depth Analysis: Automatically computes Aterian, Inc. (ATER)’s intrinsic value and Net Present Value.
- Ready-to-Use Data: Historical and projected data provide reliable foundations for analysis.
- High-Quality Insights: Perfect for financial analysts, investors, and business advisors focusing on Aterian, Inc. (ATER).
Who Should Use This Product?
- Individual Investors: Gain insights to make informed decisions about trading Aterian, Inc. (ATER) stock.
- Financial Analysts: Enhance valuation methodologies with accessible financial models tailored for Aterian, Inc. (ATER).
- Consultants: Provide clients with precise valuation analyses of Aterian, Inc. (ATER) quickly and effectively.
- Business Owners: Learn how companies like Aterian, Inc. (ATER) are valued to inform your own business strategies.
- Finance Students: Explore valuation principles using real-time data and case studies related to Aterian, Inc. (ATER).
What the Template Contains
- Comprehensive DCF Model: Editable template with detailed valuation calculations tailored for Aterian, Inc. (ATER).
- Real-World Data: Aterian’s historical and projected financials preloaded for thorough analysis.
- Customizable Parameters: Adjust WACC, growth rates, and tax assumptions to explore various scenarios.
- Financial Statements: Complete annual and quarterly breakdowns for enhanced insights into Aterian, Inc. (ATER).
- Key Ratios: Built-in analysis for profitability, efficiency, and leverage specific to Aterian, Inc. (ATER).
- Dashboard with Visual Outputs: Charts and tables for clear, actionable results related to Aterian, Inc. (ATER).
Disclaimer
All information, articles, and product details provided on this website are for general informational and educational purposes only. We do not claim any ownership over, nor do we intend to infringe upon, any trademarks, copyrights, logos, brand names, or other intellectual property mentioned or depicted on this site. Such intellectual property remains the property of its respective owners, and any references here are made solely for identification or informational purposes, without implying any affiliation, endorsement, or partnership.
We make no representations or warranties, express or implied, regarding the accuracy, completeness, or suitability of any content or products presented. Nothing on this website should be construed as legal, tax, investment, financial, medical, or other professional advice. In addition, no part of this site—including articles or product references—constitutes a solicitation, recommendation, endorsement, advertisement, or offer to buy or sell any securities, franchises, or other financial instruments, particularly in jurisdictions where such activity would be unlawful.
All content is of a general nature and may not address the specific circumstances of any individual or entity. It is not a substitute for professional advice or services. Any actions you take based on the information provided here are strictly at your own risk. You accept full responsibility for any decisions or outcomes arising from your use of this website and agree to release us from any liability in connection with your use of, or reliance upon, the content or products found herein.