
|
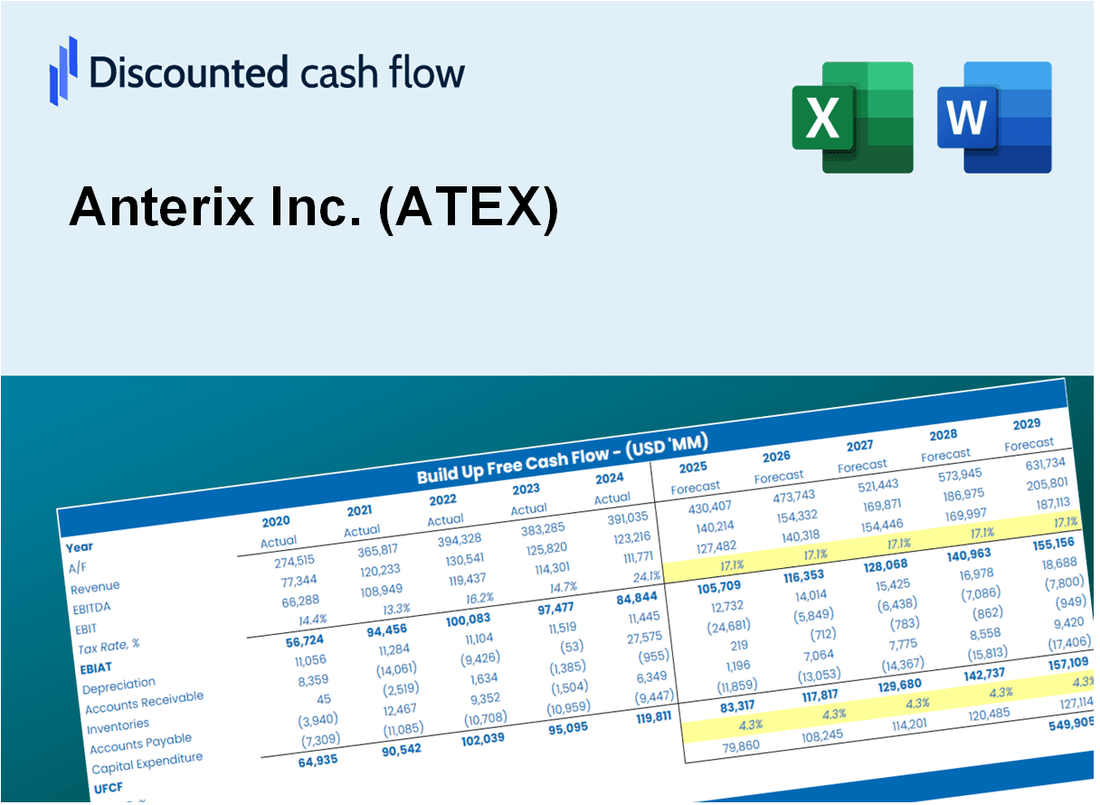
Anterix Inc. (ATEX) DCF -Bewertung |
Fully Editable: Tailor To Your Needs In Excel Or Sheets
Professional Design: Trusted, Industry-Standard Templates
Investor-Approved Valuation Models
MAC/PC Compatible, Fully Unlocked
No Expertise Is Needed; Easy To Follow
Anterix Inc. (ATEX) Bundle
Entdecken Sie das wahre Potenzial von Anterix Inc. mit unserem DCF-Taschenrechner von professionellem Qualität! Passen Sie die wichtigsten Annahmen an, erkunden Sie verschiedene Szenarien und analysieren Sie die Auswirkungen von Änderungen auf die Bewertung der Anterix Inc. (ATEX) - alles innerhalb einer einzelnen Excel -Vorlage.
What You Will Receive
- Pre-Filled Financial Model: Anterix Inc.’s actual data provides accurate DCF valuation.
- Comprehensive Forecast Control: Modify revenue growth, margins, WACC, and other essential factors.
- Immediate Calculations: Automatic updates allow you to view results in real-time as adjustments are made.
- Professional-Grade Template: A polished Excel file crafted for high-quality valuation.
- Flexible and Reusable: Designed for adaptability, making it suitable for repeated detailed forecasts.
Key Features
- Real-Time ATEX Data: Pre-populated with Anterix’s historical performance metrics and future projections.
- Fully Customizable Parameters: Modify revenue growth, profit margins, discount rates, tax implications, and capital investments.
- Interactive Valuation Framework: Automatic recalculations of Net Present Value (NPV) and intrinsic value based on user inputs.
- Scenario Analysis: Develop various forecasting scenarios to evaluate different valuation results.
- User-Centric Interface: Intuitive, organized, and suitable for both experienced professionals and newcomers.
How It Works
- 1. Download the Template: Obtain and open the Excel file featuring Anterix Inc.'s (ATEX) preloaded data.
- 2. Modify Inputs: Adjust key variables such as growth projections, WACC, and capital expenditures.
- 3. Analyze Results Immediately: The DCF model automatically computes intrinsic value and NPV.
- 4. Explore Scenarios: Evaluate various forecasts to understand different valuation possibilities.
- 5. Present with Assurance: Deliver expert valuation insights to back your strategic decisions.
Why Choose This Calculator for Anterix Inc. (ATEX)?
- Accurate Data: Utilize real Anterix financials for dependable valuation outcomes.
- Customizable: Tailor essential parameters such as growth rates, WACC, and tax rates to align with your forecasts.
- Time-Saving: Pre-configured calculations save you from building from the ground up.
- Professional-Grade Tool: Crafted for investors, analysts, and consultants in the field.
- User-Friendly: Easy-to-navigate design and clear instructions cater to users of all levels.
Who Should Use This Product?
- Individual Investors: Gain insights to make informed decisions about buying or selling Anterix Inc. (ATEX) stock.
- Financial Analysts: Enhance valuation processes with comprehensive financial models tailored for Anterix Inc. (ATEX).
- Consultants: Provide clients with accurate and timely valuation insights related to Anterix Inc. (ATEX).
- Business Owners: Learn how companies like Anterix Inc. (ATEX) are valued to inform your own business strategies.
- Finance Students: Explore valuation techniques using real-world data and case studies from Anterix Inc. (ATEX).
What the Template Contains
- Pre-Filled Data: Includes Anterix Inc.'s historical financials and forecasts.
- Discounted Cash Flow Model: Editable DCF valuation model with automatic calculations.
- Weighted Average Cost of Capital (WACC): A dedicated sheet for calculating WACC based on custom inputs.
- Key Financial Ratios: Analyze Anterix Inc.'s profitability, efficiency, and leverage.
- Customizable Inputs: Edit revenue growth, margins, and tax rates with ease.
- Clear Dashboard: Charts and tables summarizing key valuation results.
Disclaimer
All information, articles, and product details provided on this website are for general informational and educational purposes only. We do not claim any ownership over, nor do we intend to infringe upon, any trademarks, copyrights, logos, brand names, or other intellectual property mentioned or depicted on this site. Such intellectual property remains the property of its respective owners, and any references here are made solely for identification or informational purposes, without implying any affiliation, endorsement, or partnership.
We make no representations or warranties, express or implied, regarding the accuracy, completeness, or suitability of any content or products presented. Nothing on this website should be construed as legal, tax, investment, financial, medical, or other professional advice. In addition, no part of this site—including articles or product references—constitutes a solicitation, recommendation, endorsement, advertisement, or offer to buy or sell any securities, franchises, or other financial instruments, particularly in jurisdictions where such activity would be unlawful.
All content is of a general nature and may not address the specific circumstances of any individual or entity. It is not a substitute for professional advice or services. Any actions you take based on the information provided here are strictly at your own risk. You accept full responsibility for any decisions or outcomes arising from your use of this website and agree to release us from any liability in connection with your use of, or reliance upon, the content or products found herein.