
|
PLC (Auktionstechnologiegruppe) DCF -Bewertung |
Fully Editable: Tailor To Your Needs In Excel Or Sheets
Professional Design: Trusted, Industry-Standard Templates
Investor-Approved Valuation Models
MAC/PC Compatible, Fully Unlocked
No Expertise Is Needed; Easy To Follow
Auction Technology Group plc (ATG.L) Bundle
Stürzen Sie Ihre Analyse und verbessern Sie die Präzision mit unserem (ATGL) DCF -Taschenrechner! Mit Echtzeitdaten von der Auktionstechnologiegruppe PLC und anpassbaren Annahmen ermöglichen dieses Tool Sie, wie ein erfahrener Investor prognostizieren, beurteilen und value (ATGL).
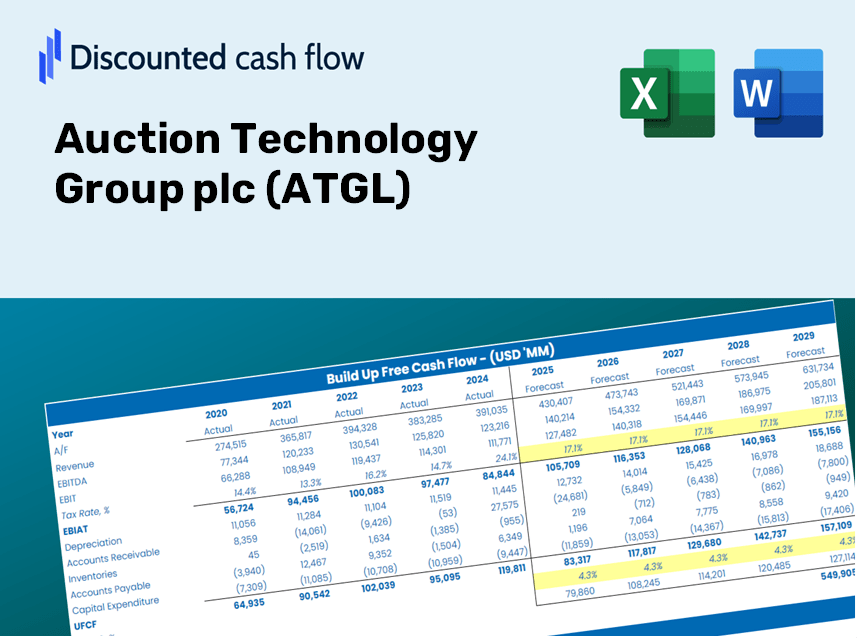
Discounted Cash Flow (DCF) - (USD MM)
| Year | AY1 2020 |
AY2 2021 |
AY3 2022 |
AY4 2023 |
AY5 2024 |
FY1 2025 |
FY2 2026 |
FY3 2027 |
FY4 2028 |
FY5 2029 |
|---|---|---|---|---|---|---|---|---|---|---|
| Revenue | 52.3 | 70.1 | 119.8 | 135.2 | 130.3 | 167.4 | 215.2 | 276.6 | 355.6 | 457.0 |
| Revenue Growth, % | 0 | 33.98 | 71.01 | 12.83 | -3.68 | 28.54 | 28.54 | 28.54 | 28.54 | 28.54 |
| EBITDA | -.1 | 10.8 | 49.0 | 49.8 | 46.4 | 43.0 | 55.3 | 71.1 | 91.4 | 117.5 |
| EBITDA, % | -0.24853 | 15.41 | 40.89 | 36.86 | 35.64 | 25.71 | 25.71 | 25.71 | 25.71 | 25.71 |
| Depreciation | 10.6 | 18.8 | 31.9 | 31.8 | 21.3 | 38.0 | 48.9 | 62.8 | 80.8 | 103.8 |
| Depreciation, % | 20.25 | 26.78 | 26.63 | 23.54 | 16.36 | 22.71 | 22.71 | 22.71 | 22.71 | 22.71 |
| EBIT | -10.7 | -8.0 | 17.1 | 18.0 | 25.1 | 5.0 | 6.5 | 8.3 | 10.7 | 13.7 |
| EBIT, % | -20.5 | -11.36 | 14.26 | 13.32 | 19.28 | 3 | 3 | 3 | 3 | 3 |
| Total Cash | 64.7 | 397.5 | 51.8 | 8.5 | 5.1 | 84.9 | 109.1 | 140.2 | 180.2 | 231.7 |
| Total Cash, percent | .0 | .0 | .0 | .0 | .0 | .0 | .0 | .0 | .0 | .0 |
| Account Receivables | 7.7 | 10.1 | 17.4 | 14.1 | 12.0 | 21.2 | 27.2 | 35.0 | 45.0 | 57.8 |
| Account Receivables, % | 14.72 | 14.46 | 14.48 | 10.42 | 9.18 | 12.65 | 12.65 | 12.65 | 12.65 | 12.65 |
| Inventories | -1.0 | .0 | .0 | .0 | .0 | -.6 | -.8 | -1.0 | -1.3 | -1.7 |
| Inventories, % | -1.82 | 0 | 0 | 0 | 0 | -0.36439 | -0.36439 | -0.36439 | -0.36439 | -0.36439 |
| Accounts Payable | 1.1 | .9 | 2.4 | 3.7 | 2.1 | 3.3 | 4.2 | 5.4 | 7.0 | 9.0 |
| Accounts Payable, % | 2.16 | 1.33 | 1.98 | 2.75 | 1.62 | 1.97 | 1.97 | 1.97 | 1.97 | 1.97 |
| Capital Expenditure | -1.8 | -2.1 | -4.5 | -9.3 | -8.4 | -7.9 | -10.1 | -13.0 | -16.8 | -21.5 |
| Capital Expenditure, % | -3.5 | -3 | -3.74 | -6.9 | -6.43 | -4.71 | -4.71 | -4.71 | -4.71 | -4.71 |
| Tax Rate, % | -31.6 | -31.6 | -31.6 | -31.6 | -31.6 | -31.6 | -31.6 | -31.6 | -31.6 | -31.6 |
| EBITAT | -8.8 | -8.7 | -11.3 | 43.0 | 33.0 | 3.8 | 4.9 | 6.3 | 8.2 | 10.5 |
| Depreciation | ||||||||||
| Changes in Account Receivables | ||||||||||
| Changes in Inventories | ||||||||||
| Changes in Accounts Payable | ||||||||||
| Capital Expenditure | ||||||||||
| UFCF | -5.7 | 4.4 | 10.4 | 70.1 | 46.5 | 26.5 | 38.7 | 49.8 | 64.0 | 82.3 |
| WACC, % | 8.27 | 8.7 | 6.23 | 8.7 | 8.7 | 8.12 | 8.12 | 8.12 | 8.12 | 8.12 |
| PV UFCF | ||||||||||
| SUM PV UFCF | 199.6 | |||||||||
| Long Term Growth Rate, % | 4.00 | |||||||||
| Free cash flow (T + 1) | 86 | |||||||||
| Terminal Value | 2,077 | |||||||||
| Present Terminal Value | 1,405 | |||||||||
| Enterprise Value | 1,605 | |||||||||
| Net Debt | 88 | |||||||||
| Equity Value | 1,517 | |||||||||
| Diluted Shares Outstanding, MM | 124 | |||||||||
| Equity Value Per Share | 1,224.69 |
What You Will Receive
- Customizable Excel Template: A fully adjustable Excel-based DCF Calculator featuring pre-filled real financial data for Auction Technology Group plc (ATGL).
- Comprehensive Data: Access to historical figures and future projections (highlighted in the yellow cells).
- Forecast Adaptability: Modify assumptions related to revenue growth, EBITDA %, and WACC as needed.
- Instant Calculations: Quickly see how your inputs affect the valuation of Auction Technology Group plc (ATGL).
- Professional Resource: Designed for investors, CFOs, consultants, and financial analysts.
- User-Friendly Layout: Organized for clarity and simplicity, complete with step-by-step guidance.
Key Features
- Advanced DCF Calculator: Offers comprehensive unlevered and levered DCF valuation models tailored for Auction Technology Group plc (ATGL).
- WACC Calculator: Features a pre-designed Weighted Average Cost of Capital sheet with options for customizable inputs.
- Editable Forecast Assumptions: Adjust growth rates, capital expenditure estimates, and discount rates as needed.
- Built-In Financial Ratios: Evaluate profitability, leverage, and efficiency ratios specific to Auction Technology Group plc (ATGL).
- Dashboard and Charts: Visual representations that distill key valuation metrics for straightforward analysis.
How It Works
- Step 1: Download the Excel spreadsheet.
- Step 2: Review the pre-filled financial data and forecasts for Auction Technology Group plc (ATGL).
- Step 3: Adjust key inputs such as revenue growth, WACC, and tax rates in the highlighted cells.
- Step 4: Observe the DCF model update in real-time as you modify your assumptions.
- Step 5: Examine the outputs and leverage the results for your investment strategies.
Why Choose This Calculator for Auction Technology Group plc (ATGL)?
- All-in-One Solution: Combines DCF, WACC, and financial ratio analyses into a single user-friendly tool.
- Flexible Customization: Modify the yellow-highlighted cells to explore different financial scenarios.
- In-Depth Analysis: Automatically estimates Auction Technology Group's intrinsic value and Net Present Value.
- Built-in Data: Features both historical and projected data to provide reliable initial insights.
- High-Quality Standards: Perfect for financial analysts, investors, and business consultants looking to evaluate ATGL effectively.
Who Can Benefit from ATGL's Services?
- Auctioneers: Enhance your bidding processes with advanced technology and analytics tools.
- Market Researchers: Streamline your data collection and analysis with our comprehensive auction insights.
- Investors: Make informed decisions by leveraging our platform for real-time market evaluations.
- Event Organizers: Effortlessly customize auction templates for unique events and maximize engagement.
- Students and Educators: Utilize our resources to gain practical experience in auction management and technology.
Contents of the Template
- Historical Data: Contains Auction Technology Group plc’s (ATGL) previous financial performance and foundational forecasts.
- DCF and Levered DCF Models: Comprehensive templates for determining the intrinsic value of Auction Technology Group plc (ATGL).
- WACC Sheet: Pre-configured calculations for the Weighted Average Cost of Capital.
- Editable Inputs: Adjust critical factors such as growth rates, EBITDA percentages, and CAPEX assumptions.
- Quarterly and Annual Statements: A thorough analysis of Auction Technology Group plc’s (ATGL) financials.
- Interactive Dashboard: Dynamically visualize valuation outcomes and projections.
Disclaimer
All information, articles, and product details provided on this website are for general informational and educational purposes only. We do not claim any ownership over, nor do we intend to infringe upon, any trademarks, copyrights, logos, brand names, or other intellectual property mentioned or depicted on this site. Such intellectual property remains the property of its respective owners, and any references here are made solely for identification or informational purposes, without implying any affiliation, endorsement, or partnership.
We make no representations or warranties, express or implied, regarding the accuracy, completeness, or suitability of any content or products presented. Nothing on this website should be construed as legal, tax, investment, financial, medical, or other professional advice. In addition, no part of this site—including articles or product references—constitutes a solicitation, recommendation, endorsement, advertisement, or offer to buy or sell any securities, franchises, or other financial instruments, particularly in jurisdictions where such activity would be unlawful.
All content is of a general nature and may not address the specific circumstances of any individual or entity. It is not a substitute for professional advice or services. Any actions you take based on the information provided here are strictly at your own risk. You accept full responsibility for any decisions or outcomes arising from your use of this website and agree to release us from any liability in connection with your use of, or reliance upon, the content or products found herein.