
|
Atomera Incorporated (Atom) DCF -Bewertung |
Fully Editable: Tailor To Your Needs In Excel Or Sheets
Professional Design: Trusted, Industry-Standard Templates
Investor-Approved Valuation Models
MAC/PC Compatible, Fully Unlocked
No Expertise Is Needed; Easy To Follow
Atomera Incorporated (ATOM) Bundle
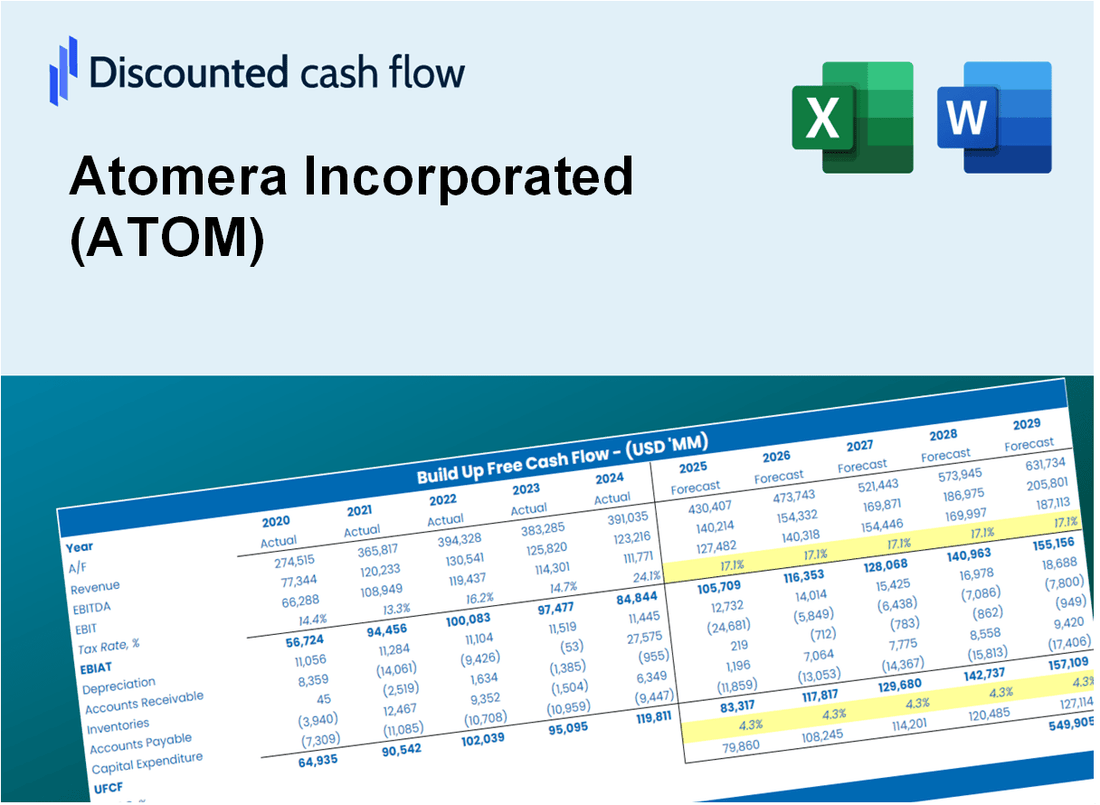
Unabhängig davon, ob Sie ein Investor oder ein Analyst sind, ist dieser (ATOM) DCF-Taschenrechner Ihre Anlaufstelle für eine genaue Bewertung. Mit realen Daten von Atomera Incorporated geladen, können Sie Prognosen anpassen und die Effekte in Echtzeit beobachten.
Discounted Cash Flow (DCF) - (USD MM)
| Year | AY1 2020 |
AY2 2021 |
AY3 2022 |
AY4 2023 |
AY5 2024 |
FY1 2025 |
FY2 2026 |
FY3 2027 |
FY4 2028 |
FY5 2029 |
|---|---|---|---|---|---|---|---|---|---|---|
| Revenue | .1 | .4 | .4 | .6 | .1 | .2 | .2 | .2 | .2 | .3 |
| Revenue Growth, % | 0 | 545.16 | -4.5 | 43.98 | -75.45 | 16.01 | 16.01 | 16.01 | 16.01 | 16.01 |
| EBITDA | -14.7 | -15.3 | -15.7 | -18.2 | -16.9 | -.2 | -.2 | -.2 | -.2 | -.3 |
| EBITDA, % | -23708.06 | -3816.75 | -4104.71 | -3301.27 | -12548.89 | -100 | -100 | -100 | -100 | -100 |
| Depreciation | .2 | .3 | 1.5 | 1.4 | 1.4 | .1 | .2 | .2 | .2 | .3 |
| Depreciation, % | 288.71 | 63.25 | 394.24 | 261.64 | 1011.11 | 92.65 | 92.65 | 92.65 | 92.65 | 92.65 |
| EBIT | -14.9 | -15.5 | -17.2 | -19.6 | -18.3 | -.2 | -.2 | -.2 | -.2 | -.3 |
| EBIT, % | -23996.77 | -3880 | -4498.95 | -3562.91 | -13560 | -100 | -100 | -100 | -100 | -100 |
| Total Cash | 37.9 | 28.7 | 21.2 | 19.5 | 26.8 | .2 | .2 | .2 | .2 | .3 |
| Total Cash, percent | .1 | .0 | .0 | .0 | .0 | .0 | .0 | .0 | .0 | .0 |
| Account Receivables | .0 | .0 | .0 | .6 | .1 | .0 | .1 | .1 | .1 | .1 |
| Account Receivables, % | 0 | 0 | 0 | 114.36 | 58.52 | 31.7 | 31.7 | 31.7 | 31.7 | 31.7 |
| Inventories | .0 | .0 | .0 | .0 | .0 | .0 | .0 | .0 | .0 | .0 |
| Inventories, % | 0 | 0 | 0 | 0 | 0 | 0 | 0 | 0 | 0 | 0 |
| Accounts Payable | .4 | .3 | .4 | .6 | .5 | .2 | .2 | .2 | .2 | .3 |
| Accounts Payable, % | 712.9 | 84.5 | 103.93 | 112.36 | 364.44 | 96.9 | 96.9 | 96.9 | 96.9 | 96.9 |
| Capital Expenditure | -.1 | -.1 | .0 | .0 | .0 | .0 | -.1 | -.1 | -.1 | -.1 |
| Capital Expenditure, % | -211.29 | -27.25 | -10.21 | -5.64 | -10.37 | -30.69 | -30.69 | -30.69 | -30.69 | -30.69 |
| Tax Rate, % | 0 | 0 | 0 | 0 | 0 | 0 | 0 | 0 | 0 | 0 |
| EBITAT | -14.7 | -15.6 | -17.1 | -19.6 | -18.3 | -.2 | -.2 | -.2 | -.2 | -.3 |
| Depreciation | ||||||||||
| Changes in Account Receivables | ||||||||||
| Changes in Inventories | ||||||||||
| Changes in Accounts Payable | ||||||||||
| Capital Expenditure | ||||||||||
| UFCF | -14.2 | -15.5 | -15.6 | -18.6 | -16.5 | -.4 | -.1 | -.1 | -.1 | -.1 |
| WACC, % | 8.46 | 8.46 | 8.46 | 8.46 | 8.46 | 8.46 | 8.46 | 8.46 | 8.46 | 8.46 |
| PV UFCF | ||||||||||
| SUM PV UFCF | -.5 | |||||||||
| Long Term Growth Rate, % | 2.00 | |||||||||
| Free cash flow (T + 1) | 0 | |||||||||
| Terminal Value | -1 | |||||||||
| Present Terminal Value | -1 | |||||||||
| Enterprise Value | -1 | |||||||||
| Net Debt | -24 | |||||||||
| Equity Value | 22 | |||||||||
| Diluted Shares Outstanding, MM | 27 | |||||||||
| Equity Value Per Share | 0.82 |
What You Will Get
- Editable Forecast Inputs: Seamlessly modify assumptions (growth %, margins, WACC) to explore various scenarios.
- Real-World Data: Atomera Incorporated’s (ATOM) financial data pre-filled to kickstart your analysis.
- Automatic DCF Outputs: The template computes Net Present Value (NPV) and intrinsic value automatically.
- Customizable and Professional: A refined Excel model that adjusts to your valuation requirements.
- Built for Analysts and Investors: Perfect for evaluating projections, confirming strategies, and enhancing efficiency.
Key Features
- 🔍 Real-Life ATOM Financials: Pre-filled historical and projected data for Atomera Incorporated (ATOM).
- ✏️ Fully Customizable Inputs: Adjust all critical parameters (yellow cells) like WACC, growth %, and tax rates.
- 📊 Professional DCF Valuation: Built-in formulas calculate Atomera’s intrinsic value using the Discounted Cash Flow method.
- ⚡ Instant Results: Visualize Atomera’s valuation instantly after making changes.
- Scenario Analysis: Test and compare outcomes for various financial assumptions side-by-side.
How It Works
- Step 1: Download the prebuilt Excel template featuring Atomera Incorporated’s (ATOM) data.
- Step 2: Navigate through the pre-filled sheets to familiarize yourself with the key metrics.
- Step 3: Modify forecasts and assumptions in the editable yellow cells (WACC, growth, margins).
- Step 4: Instantly see the recalculated results, including Atomera Incorporated’s (ATOM) intrinsic value.
- Step 5: Make well-informed investment decisions or create reports based on the outputs.
Why Choose This Calculator for Atomera Incorporated (ATOM)?
- Accuracy: Utilizes real Atomera financials for precise data analysis.
- Flexibility: Tailored for users to easily test and adjust inputs as needed.
- Time-Saving: Avoid the complexities of constructing a DCF model from the ground up.
- Professional-Grade: Crafted with the precision and usability expected by CFOs.
- User-Friendly: Intuitive design ensures accessibility for users with varying levels of financial expertise.
Who Should Use This Product?
- Investors: Evaluate Atomera's valuation before making stock transactions.
- CFOs and Financial Analysts: Enhance valuation processes and validate financial forecasts.
- Startup Founders: Discover how established companies like Atomera are assessed in the market.
- Consultants: Provide detailed valuation analyses for clients seeking insights on Atomera.
- Students and Educators: Utilize real-time data to practice and instruct on valuation methodologies.
What the Template Contains
- Pre-Filled Data: Includes Atomera Incorporated's historical financials and forecasts.
- Discounted Cash Flow Model: Editable DCF valuation model with automatic calculations.
- Weighted Average Cost of Capital (WACC): A dedicated sheet for calculating WACC based on custom inputs.
- Key Financial Ratios: Analyze Atomera Incorporated's profitability, efficiency, and leverage.
- Customizable Inputs: Edit revenue growth, margins, and tax rates with ease.
- Clear Dashboard: Charts and tables summarizing key valuation results.
Disclaimer
All information, articles, and product details provided on this website are for general informational and educational purposes only. We do not claim any ownership over, nor do we intend to infringe upon, any trademarks, copyrights, logos, brand names, or other intellectual property mentioned or depicted on this site. Such intellectual property remains the property of its respective owners, and any references here are made solely for identification or informational purposes, without implying any affiliation, endorsement, or partnership.
We make no representations or warranties, express or implied, regarding the accuracy, completeness, or suitability of any content or products presented. Nothing on this website should be construed as legal, tax, investment, financial, medical, or other professional advice. In addition, no part of this site—including articles or product references—constitutes a solicitation, recommendation, endorsement, advertisement, or offer to buy or sell any securities, franchises, or other financial instruments, particularly in jurisdictions where such activity would be unlawful.
All content is of a general nature and may not address the specific circumstances of any individual or entity. It is not a substitute for professional advice or services. Any actions you take based on the information provided here are strictly at your own risk. You accept full responsibility for any decisions or outcomes arising from your use of this website and agree to release us from any liability in connection with your use of, or reliance upon, the content or products found herein.