
|
Atara Biotherapeutics, Inc. (ATRA) DCF -Bewertung |
Fully Editable: Tailor To Your Needs In Excel Or Sheets
Professional Design: Trusted, Industry-Standard Templates
Investor-Approved Valuation Models
MAC/PC Compatible, Fully Unlocked
No Expertise Is Needed; Easy To Follow
Atara Biotherapeutics, Inc. (ATRA) Bundle
Vereinfachen Sie die Bewertung von Atara Biotherapeutics, Inc. (ATRA) mit diesem anpassbaren DCF -Taschenrechner! Mit Real Atara Biotherapeutics, Inc. (ATRA) -Fonds und einstellbaren Prognoseeingaben können Sie Szenarien testen und Atara Biotherapeutics, Inc. (ATRA) in wenigen Minuten aufdecken.
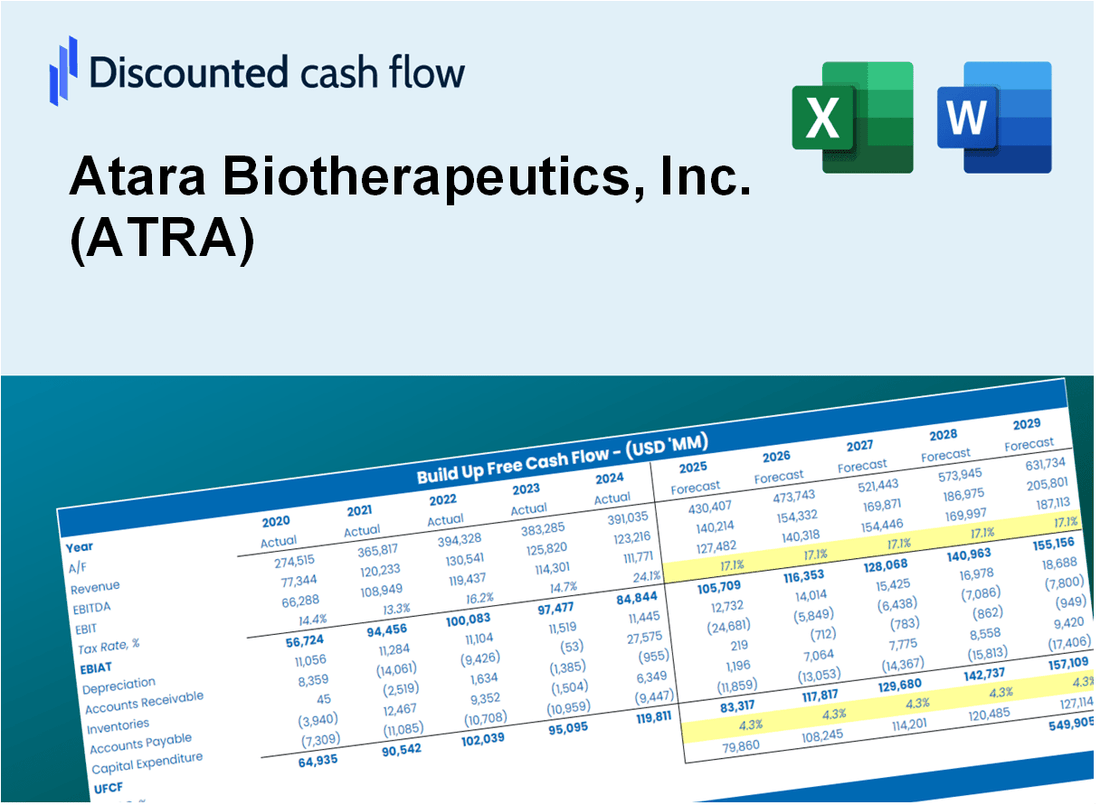
Discounted Cash Flow (DCF) - (USD MM)
| Year | AY1 2020 |
AY2 2021 |
AY3 2022 |
AY4 2023 |
AY5 2024 |
FY1 2025 |
FY2 2026 |
FY3 2027 |
FY4 2028 |
FY5 2029 |
|---|---|---|---|---|---|---|---|---|---|---|
| Revenue | .0 | 20.3 | 63.6 | 8.6 | 128.9 | 165.5 | 212.5 | 272.8 | 350.2 | 449.5 |
| Revenue Growth, % | 0 | 0 | 212.55 | -86.51 | 1404.02 | 28.37 | 28.37 | 28.37 | 28.37 | 28.37 |
| EBITDA | -300.7 | -331.1 | -213.7 | -266.0 | -75.7 | -85.7 | -110.0 | -141.2 | -181.2 | -232.6 |
| EBITDA, % | 100 | -1627.91 | -336.18 | -3102.73 | -58.75 | -51.75 | -51.75 | -51.75 | -51.75 | -51.75 |
| Depreciation | 8.3 | 9.3 | 14.6 | 4.8 | 5.1 | 75.8 | 97.4 | 125.0 | 160.4 | 206.0 |
| Depreciation, % | 100 | 45.94 | 22.92 | 56.33 | 3.92 | 45.82 | 45.82 | 45.82 | 45.82 | 45.82 |
| EBIT | -309.1 | -340.5 | -228.3 | -270.8 | -80.8 | -87.0 | -111.6 | -143.3 | -183.9 | -236.1 |
| EBIT, % | 100 | -1673.85 | -359.1 | -3159.06 | -62.66 | -52.53 | -52.53 | -52.53 | -52.53 | -52.53 |
| Total Cash | 500.7 | 371.1 | 242.8 | 51.7 | 42.5 | 143.3 | 184.0 | 236.2 | 303.2 | 389.2 |
| Total Cash, percent | .0 | .0 | .0 | .0 | .0 | .0 | .0 | .0 | .0 | .0 |
| Account Receivables | 1.3 | 1.0 | 40.2 | 34.1 | 1.5 | 89.1 | 114.4 | 146.9 | 188.6 | 242.1 |
| Account Receivables, % | 100 | 4.85 | 63.27 | 397.85 | 1.15 | 53.85 | 53.85 | 53.85 | 53.85 | 53.85 |
| Inventories | .0 | .0 | 1.6 | 9.7 | 10.7 | 69.8 | 89.6 | 115.0 | 147.6 | 189.5 |
| Inventories, % | 100 | 0 | 2.49 | 113.22 | 8.26 | 42.15 | 42.15 | 42.15 | 42.15 | 42.15 |
| Accounts Payable | 7.1 | 17.4 | 6.9 | 3.7 | 4.4 | 80.3 | 103.1 | 132.3 | 169.9 | 218.1 |
| Accounts Payable, % | 100 | 85.39 | 10.81 | 42.97 | 3.39 | 48.51 | 48.51 | 48.51 | 48.51 | 48.51 |
| Capital Expenditure | -4.5 | -10.6 | -4.2 | -1.2 | -.2 | -24.2 | -31.1 | -39.9 | -51.2 | -65.7 |
| Capital Expenditure, % | 100 | -52.02 | -6.6 | -14.27 | -0.19079 | -14.61 | -14.61 | -14.61 | -14.61 | -14.61 |
| Tax Rate, % | 0.01404905 | 0.01404905 | 0.01404905 | 0.01404905 | 0.01404905 | 0.01404905 | 0.01404905 | 0.01404905 | 0.01404905 | 0.01404905 |
| EBITAT | -309.1 | -340.5 | -2,283.0 | -270.8 | -80.8 | -87.0 | -111.6 | -143.3 | -183.9 | -236.1 |
| Depreciation | ||||||||||
| Changes in Account Receivables | ||||||||||
| Changes in Inventories | ||||||||||
| Changes in Accounts Payable | ||||||||||
| Capital Expenditure | ||||||||||
| UFCF | -299.4 | -331.2 | -2,324.0 | -272.4 | -43.6 | -106.1 | -67.6 | -86.8 | -111.4 | -143.0 |
| WACC, % | 6.43 | 6.43 | 6.43 | 6.43 | 6.43 | 6.43 | 6.43 | 6.43 | 6.43 | 6.43 |
| PV UFCF | ||||||||||
| SUM PV UFCF | -423.0 | |||||||||
| Long Term Growth Rate, % | 2.00 | |||||||||
| Free cash flow (T + 1) | -146 | |||||||||
| Terminal Value | -3,295 | |||||||||
| Present Terminal Value | -2,413 | |||||||||
| Enterprise Value | -2,836 | |||||||||
| Net Debt | 19 | |||||||||
| Equity Value | -2,855 | |||||||||
| Diluted Shares Outstanding, MM | 7 | |||||||||
| Equity Value Per Share | -381.22 |
What You Will Get
- Editable Excel Template: A fully customizable Excel-based DCF Calculator featuring pre-filled real ATRA financials.
- Real-World Data: Historical data and forward-looking estimates (highlighted in the yellow cells).
- Forecast Flexibility: Modify forecast assumptions such as revenue growth, EBITDA %, and WACC.
- Automatic Calculations: Instantly observe the impact of your inputs on Atara Biotherapeutics’ valuation.
- Professional Tool: Designed for investors, CFOs, consultants, and financial analysts.
- User-Friendly Design: Organized for clarity and ease of use, complete with step-by-step instructions.
Key Features
- Comprehensive Financial Data: Access precise historical and projected financial information for Atara Biotherapeutics, Inc. (ATRA).
- Adjustable Forecast Parameters: Modify highlighted cells for assumptions like WACC, growth rates, and profit margins.
- Real-Time Calculations: Automatic updates to DCF, Net Present Value (NPV), and cash flow assessments.
- User-Friendly Dashboard: Intuitive charts and summaries to easily interpret your valuation findings.
- Suitable for All Levels: A straightforward, user-friendly design tailored for investors, CFOs, and consultants alike.
How It Works
- Download the Template: Gain immediate access to the Excel-based ATRA DCF Calculator.
- Input Your Assumptions: Modify the yellow-highlighted cells for growth rates, WACC, margins, and additional parameters.
- Instant Calculations: The model automatically updates Atara Biotherapeutics’ intrinsic value.
- Test Scenarios: Experiment with various assumptions to assess potential valuation shifts.
- Analyze and Decide: Utilize the results to inform your investment or financial strategy.
Why Choose the Atara Biotherapeutics Calculator?
- Accuracy: Leverages real Atara financials for precise data.
- Flexibility: Built for users to easily test and adjust inputs as needed.
- Time-Saving: Eliminate the complexity of constructing a DCF model from the ground up.
- Professional-Grade: Crafted with the precision and usability expected by CFOs.
- User-Friendly: Intuitive interface suitable for users without extensive financial modeling expertise.
Who Should Use This Product?
- Biotech Students: Explore drug development processes and apply them using real-world data.
- Researchers: Integrate advanced therapeutic models into academic studies or clinical research.
- Investors: Validate your investment strategies and evaluate valuation metrics for Atara Biotherapeutics (ATRA).
- Market Analysts: Enhance your analysis with a comprehensive, customizable financial model focused on biotech.
- Healthcare Entrepreneurs: Understand how large biotech firms like Atara Biotherapeutics (ATRA) are evaluated in the market.
What the Template Contains
- Historical Data: Includes Atara Biotherapeutics’ past financials and baseline forecasts.
- DCF and Levered DCF Models: Detailed templates to calculate Atara Biotherapeutics’ intrinsic value.
- WACC Sheet: Pre-built calculations for Weighted Average Cost of Capital.
- Editable Inputs: Modify key drivers like growth rates, EBITDA %, and CAPEX assumptions.
- Quarterly and Annual Statements: A complete breakdown of Atara Biotherapeutics’ financials.
- Interactive Dashboard: Visualize valuation results and projections dynamically.
Disclaimer
All information, articles, and product details provided on this website are for general informational and educational purposes only. We do not claim any ownership over, nor do we intend to infringe upon, any trademarks, copyrights, logos, brand names, or other intellectual property mentioned or depicted on this site. Such intellectual property remains the property of its respective owners, and any references here are made solely for identification or informational purposes, without implying any affiliation, endorsement, or partnership.
We make no representations or warranties, express or implied, regarding the accuracy, completeness, or suitability of any content or products presented. Nothing on this website should be construed as legal, tax, investment, financial, medical, or other professional advice. In addition, no part of this site—including articles or product references—constitutes a solicitation, recommendation, endorsement, advertisement, or offer to buy or sell any securities, franchises, or other financial instruments, particularly in jurisdictions where such activity would be unlawful.
All content is of a general nature and may not address the specific circumstances of any individual or entity. It is not a substitute for professional advice or services. Any actions you take based on the information provided here are strictly at your own risk. You accept full responsibility for any decisions or outcomes arising from your use of this website and agree to release us from any liability in connection with your use of, or reliance upon, the content or products found herein.