
|
Atricure, Inc. (ATRC) DCF -Bewertung |
Fully Editable: Tailor To Your Needs In Excel Or Sheets
Professional Design: Trusted, Industry-Standard Templates
Investor-Approved Valuation Models
MAC/PC Compatible, Fully Unlocked
No Expertise Is Needed; Easy To Follow
AtriCure, Inc. (ATRC) Bundle
Unser (ATRC) DCF -Taschenrechner entwickelt für die Genauigkeit und ermöglicht es Ihnen, die Bewertung von Atricure, Inc. anhand der tatsächlichen Finanzdaten zu bewerten und vollständige Flexibilität zu bieten, um alle Schlüsselparameter für verbesserte Projektionen zu ändern.
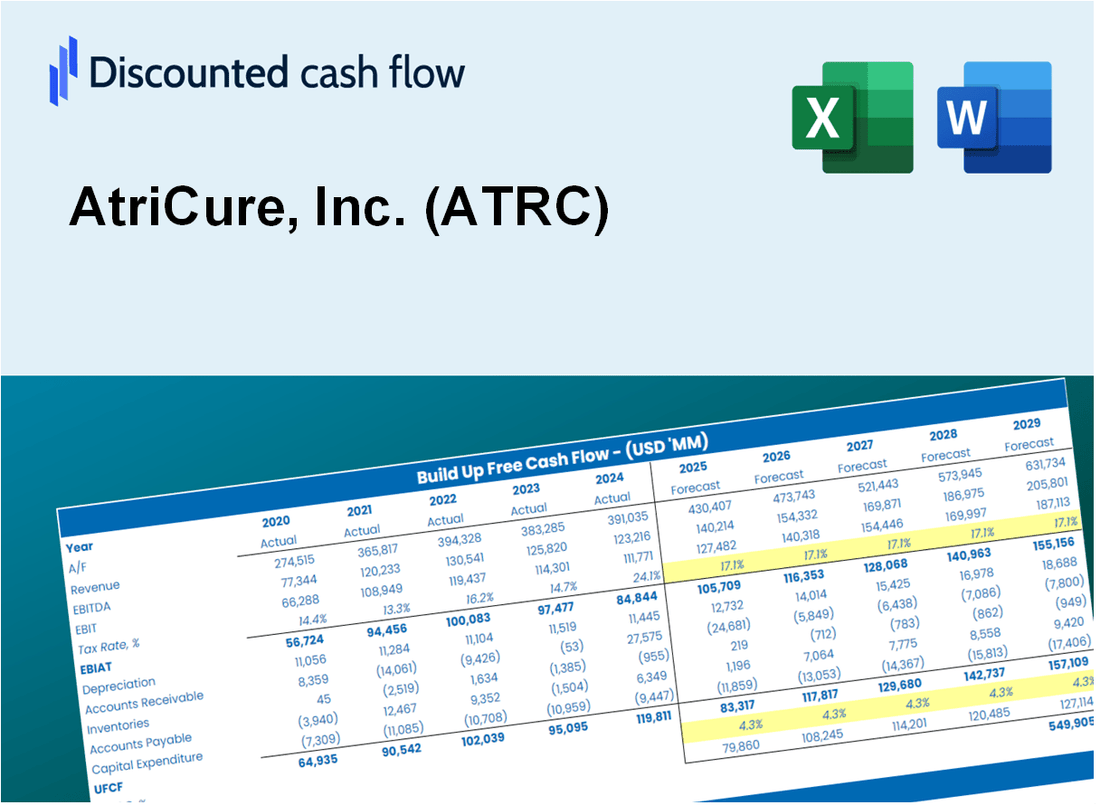
Discounted Cash Flow (DCF) - (USD MM)
| Year | AY1 2020 |
AY2 2021 |
AY3 2022 |
AY4 2023 |
AY5 2024 |
FY1 2025 |
FY2 2026 |
FY3 2027 |
FY4 2028 |
FY5 2029 |
|---|---|---|---|---|---|---|---|---|---|---|
| Revenue | 206.5 | 274.3 | 330.4 | 399.2 | 465.3 | 570.8 | 700.1 | 858.8 | 1,053.4 | 1,292.1 |
| Revenue Growth, % | 0 | 32.83 | 20.43 | 20.84 | 16.55 | 22.66 | 22.66 | 22.66 | 22.66 | 22.66 |
| EBITDA | -33.6 | -36.9 | -29.5 | -8.1 | -18.5 | -51.0 | -62.5 | -76.7 | -94.1 | -115.4 |
| EBITDA, % | -16.27 | -13.43 | -8.93 | -2.03 | -3.98 | -8.93 | -8.93 | -8.93 | -8.93 | -8.93 |
| Depreciation | 9.5 | 10.4 | 11.7 | 14.8 | 18.7 | 22.5 | 27.6 | 33.9 | 41.5 | 50.9 |
| Depreciation, % | 4.62 | 3.81 | 3.54 | 3.71 | 4.03 | 3.94 | 3.94 | 3.94 | 3.94 | 3.94 |
| EBIT | -43.2 | -47.3 | -41.2 | -22.9 | -37.3 | -73.5 | -90.1 | -110.5 | -135.6 | -166.3 |
| EBIT, % | -20.9 | -17.24 | -12.47 | -5.74 | -8.01 | -12.87 | -12.87 | -12.87 | -12.87 | -12.87 |
| Total Cash | 244.2 | 119.1 | 121.1 | 137.3 | 122.7 | 274.9 | 337.2 | 413.6 | 507.4 | 622.4 |
| Total Cash, percent | .0 | .0 | .0 | .0 | .0 | .0 | .0 | .0 | .0 | .0 |
| Account Receivables | 23.1 | 33.0 | 42.7 | 52.5 | 60.3 | 71.1 | 87.2 | 107.0 | 131.2 | 161.0 |
| Account Receivables, % | 11.21 | 12.04 | 12.92 | 13.15 | 12.97 | 12.46 | 12.46 | 12.46 | 12.46 | 12.46 |
| Inventories | 35.0 | 39.0 | 45.9 | 67.9 | 75.3 | 89.3 | 109.6 | 134.4 | 164.9 | 202.2 |
| Inventories, % | 16.96 | 14.2 | 13.9 | 17.01 | 16.19 | 15.65 | 15.65 | 15.65 | 15.65 | 15.65 |
| Accounts Payable | 12.7 | 18.6 | 19.9 | 27.4 | 25.0 | 35.6 | 43.7 | 53.6 | 65.7 | 80.6 |
| Accounts Payable, % | 6.17 | 6.78 | 6.02 | 6.85 | 5.38 | 6.24 | 6.24 | 6.24 | 6.24 | 6.24 |
| Capital Expenditure | -5.3 | -9.8 | -16.9 | -42.0 | -23.5 | -30.6 | -37.5 | -46.0 | -56.4 | -69.2 |
| Capital Expenditure, % | -2.55 | -3.56 | -5.11 | -10.52 | -5.04 | -5.35 | -5.35 | -5.35 | -5.35 | -5.35 |
| Tax Rate, % | -2.34 | -2.34 | -2.34 | -2.34 | -2.34 | -2.34 | -2.34 | -2.34 | -2.34 | -2.34 |
| EBITAT | -43.3 | -47.1 | -41.5 | -23.4 | -38.1 | -73.4 | -90.1 | -110.5 | -135.5 | -166.2 |
| Depreciation | ||||||||||
| Changes in Account Receivables | ||||||||||
| Changes in Inventories | ||||||||||
| Changes in Accounts Payable | ||||||||||
| Capital Expenditure | ||||||||||
| UFCF | -84.4 | -54.4 | -62.0 | -74.9 | -60.5 | -95.7 | -128.2 | -157.3 | -192.9 | -236.7 |
| WACC, % | 10.61 | 10.61 | 10.61 | 10.61 | 10.61 | 10.61 | 10.61 | 10.61 | 10.61 | 10.61 |
| PV UFCF | ||||||||||
| SUM PV UFCF | -579.3 | |||||||||
| Long Term Growth Rate, % | 2.00 | |||||||||
| Free cash flow (T + 1) | -241 | |||||||||
| Terminal Value | -2,804 | |||||||||
| Present Terminal Value | -1,693 | |||||||||
| Enterprise Value | -2,273 | |||||||||
| Net Debt | -46 | |||||||||
| Equity Value | -2,227 | |||||||||
| Diluted Shares Outstanding, MM | 47 | |||||||||
| Equity Value Per Share | -47.41 |
What You Will Get
- Real AtriCure Data: Preloaded financials – from revenue to EBIT – based on actual and projected figures for AtriCure, Inc. (ATRC).
- Full Customization: Adjust all critical parameters (yellow cells) like WACC, growth %, and tax rates to fit AtriCure's specific context.
- Instant Valuation Updates: Automatic recalculations to analyze the impact of changes on AtriCure’s fair value.
- Versatile Excel Template: Tailored for quick edits, scenario testing, and detailed projections relevant to AtriCure, Inc. (ATRC).
- Time-Saving and Accurate: Skip building models from scratch while maintaining precision and flexibility for AtriCure’s financial analysis.
Key Features
- Comprehensive Data: AtriCure’s historical financial statements and pre-filled forecasts.
- Customizable Inputs: Modify WACC, tax rates, revenue growth, and EBITDA margins as needed.
- Real-Time Results: View AtriCure’s intrinsic value update instantly.
- Intuitive Visual Outputs: Dashboard charts illustrate valuation results and essential metrics.
- Designed for Precision: A professional-grade tool for analysts, investors, and finance professionals.
How It Works
- Step 1: Download the Excel file.
- Step 2: Review pre-entered AtriCure, Inc. (ATRC) data (historical and projected).
- Step 3: Adjust key assumptions (yellow cells) based on your analysis.
- Step 4: View automatic recalculations for AtriCure, Inc. (ATRC)’s intrinsic value.
- Step 5: Use the outputs for investment decisions or reporting.
Why Choose This Calculator for AtriCure, Inc. (ATRC)?
- Accuracy: Utilizes authentic AtriCure financials to ensure precise data.
- Flexibility: Tailored for users to easily test and adjust inputs as needed.
- Time-Saving: Eliminate the complexities of creating a DCF model from the ground up.
- Professional-Grade: Crafted with the precision and usability expected at the CFO level.
- User-Friendly: Intuitive design makes it accessible for users with limited financial modeling skills.
Who Should Use This Product?
- Investors: Accurately estimate AtriCure, Inc.’s (ATRC) fair value before making investment decisions.
- CFOs: Leverage a professional-grade DCF model for financial reporting and analysis related to AtriCure, Inc. (ATRC).
- Consultants: Quickly adapt the template for valuation reports tailored for AtriCure, Inc. (ATRC) clients.
- Entrepreneurs: Gain insights into financial modeling used by leading healthcare companies like AtriCure, Inc. (ATRC).
- Educators: Use it as a teaching tool to demonstrate valuation methodologies applicable to AtriCure, Inc. (ATRC).
What the Template Contains
- Pre-Filled DCF Model: AtriCure’s financial data preloaded for immediate use.
- WACC Calculator: Detailed calculations for Weighted Average Cost of Capital.
- Financial Ratios: Evaluate AtriCure’s profitability, leverage, and efficiency.
- Editable Inputs: Change assumptions such as growth, margins, and CAPEX to fit your scenarios.
- Financial Statements: Annual and quarterly reports to support detailed analysis.
- Interactive Dashboard: Easily visualize key valuation metrics and results.
Disclaimer
All information, articles, and product details provided on this website are for general informational and educational purposes only. We do not claim any ownership over, nor do we intend to infringe upon, any trademarks, copyrights, logos, brand names, or other intellectual property mentioned or depicted on this site. Such intellectual property remains the property of its respective owners, and any references here are made solely for identification or informational purposes, without implying any affiliation, endorsement, or partnership.
We make no representations or warranties, express or implied, regarding the accuracy, completeness, or suitability of any content or products presented. Nothing on this website should be construed as legal, tax, investment, financial, medical, or other professional advice. In addition, no part of this site—including articles or product references—constitutes a solicitation, recommendation, endorsement, advertisement, or offer to buy or sell any securities, franchises, or other financial instruments, particularly in jurisdictions where such activity would be unlawful.
All content is of a general nature and may not address the specific circumstances of any individual or entity. It is not a substitute for professional advice or services. Any actions you take based on the information provided here are strictly at your own risk. You accept full responsibility for any decisions or outcomes arising from your use of this website and agree to release us from any liability in connection with your use of, or reliance upon, the content or products found herein.