
|
Avadel Pharmaceuticals Plc (AVDL) DCF -Bewertung |
Fully Editable: Tailor To Your Needs In Excel Or Sheets
Professional Design: Trusted, Industry-Standard Templates
Investor-Approved Valuation Models
MAC/PC Compatible, Fully Unlocked
No Expertise Is Needed; Easy To Follow
Avadel Pharmaceuticals plc (AVDL) Bundle
Vereinfachen Sie die Bewertung der Avadel Pharmaceuticals Plc (AVDL) mit diesem anpassbaren DCF -Taschenrechner! Mit Real Avadel Pharmaceuticals Plc (AVDL) Financials und einstellbaren Prognoseeingängen können Sie Szenarien testen und Avadel Pharmaceuticals Plc (AVDL) in wenigen Minuten aufdecken.
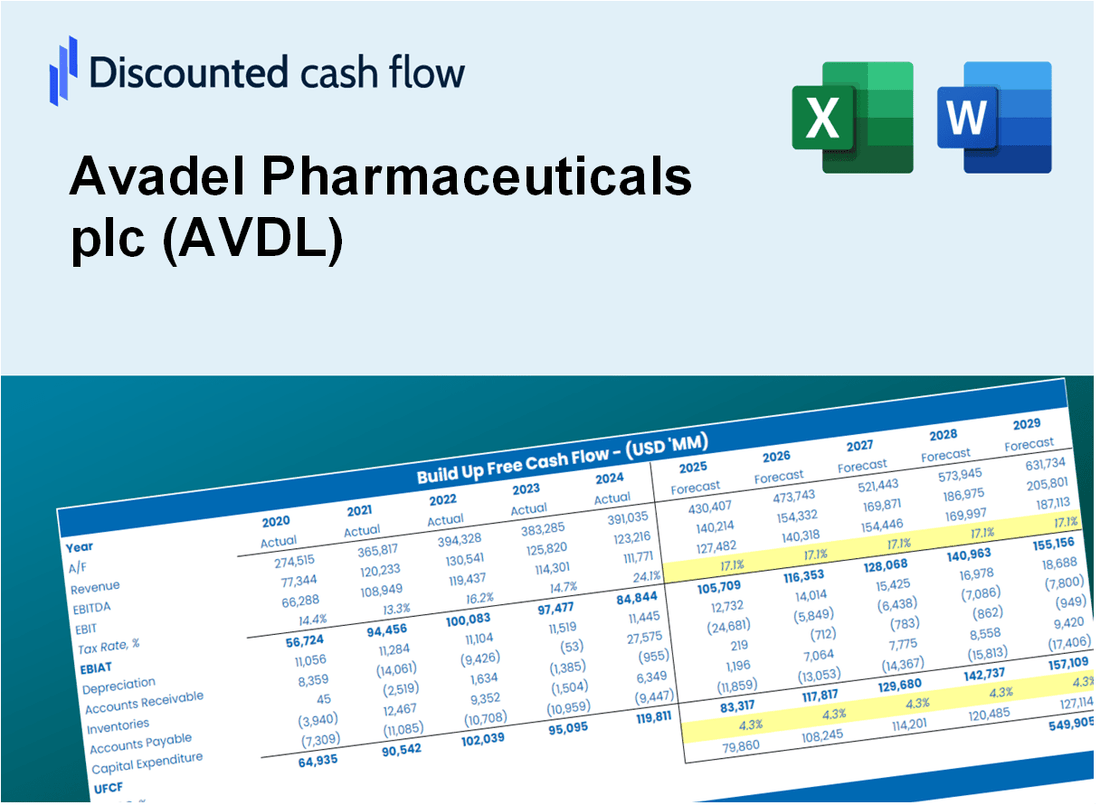
Discounted Cash Flow (DCF) - (USD MM)
| Year | AY1 2020 |
AY2 2021 |
AY3 2022 |
AY4 2023 |
AY5 2024 |
FY1 2025 |
FY2 2026 |
FY3 2027 |
FY4 2028 |
FY5 2029 |
|---|---|---|---|---|---|---|---|---|---|---|
| Revenue | 22.3 | .0 | .0 | 28.0 | 169.1 | 169.1 | 169.1 | 169.1 | 169.1 | 169.1 |
| Revenue Growth, % | 0 | -100 | 0 | 0 | 504.79 | 0 | 0 | 0 | 0 | 0 |
| EBITDA | 9.6 | -82.4 | -97.6 | -149.1 | -35.6 | 41.3 | 41.3 | 41.3 | 41.3 | 41.3 |
| EBITDA, % | 42.99 | 100 | 100 | -533.29 | -21.03 | 24.39 | 24.39 | 24.39 | 24.39 | 24.39 |
| Depreciation | 1.7 | .8 | 1.5 | 1.8 | 2.7 | 72.9 | 72.9 | 72.9 | 72.9 | 72.9 |
| Depreciation, % | 7.57 | 100 | 100 | 6.32 | 1.59 | 43.09 | 43.09 | 43.09 | 43.09 | 43.09 |
| EBIT | 7.9 | -83.2 | -99.1 | -150.9 | -38.2 | 38.2 | 38.2 | 38.2 | 38.2 | 38.2 |
| EBIT, % | 35.43 | 100 | 100 | -539.61 | -22.62 | 22.56 | 22.56 | 22.56 | 22.56 | 22.56 |
| Total Cash | 221.4 | 157.2 | 96.5 | 105.1 | 73.8 | 150.0 | 150.0 | 150.0 | 150.0 | 150.0 |
| Total Cash, percent | .0 | .0 | .0 | .0 | .0 | .0 | .0 | .0 | .0 | .0 |
| Account Receivables | 38.8 | 31.5 | 2.2 | 12.1 | 34.1 | 122.9 | 122.9 | 122.9 | 122.9 | 122.9 |
| Account Receivables, % | 173.65 | 100 | 100 | 43.28 | 20.16 | 72.69 | 72.69 | 72.69 | 72.69 | 72.69 |
| Inventories | .0 | .0 | .0 | 10.4 | 20.3 | 84.3 | 84.3 | 84.3 | 84.3 | 84.3 |
| Inventories, % | 0 | 100 | 100 | 37.12 | 12 | 49.82 | 49.82 | 49.82 | 49.82 | 49.82 |
| Accounts Payable | 2.9 | 7.7 | 7.9 | 11.4 | 7.3 | 87.4 | 87.4 | 87.4 | 87.4 | 87.4 |
| Accounts Payable, % | 13.14 | 100 | 100 | 40.89 | 4.33 | 51.67 | 51.67 | 51.67 | 51.67 | 51.67 |
| Capital Expenditure | -.1 | .0 | -.7 | .0 | .0 | -.1 | -.1 | -.1 | -.1 | -.1 |
| Capital Expenditure, % | -0.43879 | 100 | 100 | 0 | 0 | -0.08775857 | -0.08775857 | -0.08775857 | -0.08775857 | -0.08775857 |
| Tax Rate, % | 0.50327 | 0.50327 | 0.50327 | 0.50327 | 0.50327 | 0.50327 | 0.50327 | 0.50327 | 0.50327 | 0.50327 |
| EBITAT | -10.9 | -69.1 | -122.2 | -150.4 | -38.1 | 29.2 | 29.2 | 29.2 | 29.2 | 29.2 |
| Depreciation | ||||||||||
| Changes in Account Receivables | ||||||||||
| Changes in Inventories | ||||||||||
| Changes in Accounts Payable | ||||||||||
| Capital Expenditure | ||||||||||
| UFCF | -45.2 | -56.3 | -92.0 | -165.3 | -71.4 | 29.2 | 101.9 | 101.9 | 101.9 | 101.9 |
| WACC, % | 10.7 | 11.1 | 11.18 | 11.18 | 11.18 | 11.07 | 11.07 | 11.07 | 11.07 | 11.07 |
| PV UFCF | ||||||||||
| SUM PV UFCF | 310.5 | |||||||||
| Long Term Growth Rate, % | 2.00 | |||||||||
| Free cash flow (T + 1) | 104 | |||||||||
| Terminal Value | 1,146 | |||||||||
| Present Terminal Value | 678 | |||||||||
| Enterprise Value | 989 | |||||||||
| Net Debt | -50 | |||||||||
| Equity Value | 1,039 | |||||||||
| Diluted Shares Outstanding, MM | 95 | |||||||||
| Equity Value Per Share | 10.92 |
What You Will Receive
- Genuine Avadel Data: Preloaded financials – encompassing revenue to EBIT – derived from actual and projected figures.
- Comprehensive Customization: Modify all essential parameters (yellow cells) such as WACC, growth %, and tax rates.
- Immediate Valuation Adjustments: Automatic recalculations to evaluate the effects of changes on Avadel’s fair value.
- Flexible Excel Template: Designed for quick modifications, scenario analysis, and in-depth projections.
- Efficient and Precise: Avoid the hassle of building models from the ground up while ensuring accuracy and adaptability.
Key Features
- Comprehensive AVDL Data: Includes Avadel Pharmaceuticals' historical financial performance and future projections.
- Fully Customizable Inputs: Tailor revenue growth, profit margins, discount rates, tax implications, and capital investments.
- Dynamic Valuation Model: Instantaneous updates to Net Present Value (NPV) and intrinsic value based on your specified inputs.
- Scenario Testing: Develop various forecast scenarios to evaluate different valuation results.
- User-Friendly Design: Intuitive, organized, and suitable for both professionals and novices.
How It Works
- Step 1: Download the Excel file.
- Step 2: Review pre-entered Avadel Pharmaceuticals data (historical and projected).
- Step 3: Adjust key assumptions (yellow cells) based on your analysis.
- Step 4: View automatic recalculations for Avadel Pharmaceuticals' intrinsic value.
- Step 5: Use the outputs for investment decisions or reporting.
Why Choose Avadel Pharmaceuticals plc (AVDL)?
- Innovative Solutions: Cutting-edge therapies designed to meet unmet medical needs.
- Proven Track Record: A history of successful product development and market introduction.
- Patient-Centric Approach: Commitment to improving patient outcomes and quality of life.
- Expert Team: A dedicated group of professionals with extensive industry experience.
- Strong Partnerships: Collaborations with leading organizations to enhance research and development.
Who Should Use Avadel Pharmaceuticals plc (AVDL)?
- Investors: Gain insights and make informed decisions with a reliable resource on Avadel's market performance.
- Financial Analysts: Streamline your analysis with comprehensive data and reports tailored for Avadel Pharmaceuticals.
- Consultants: Easily modify and present valuable information about Avadel to your clients.
- Healthcare Enthusiasts: Explore the latest developments in pharmaceuticals and their impact on Avadel's growth.
- Educators and Students: Utilize this information as a case study in pharmaceutical finance and industry trends.
What the Template Contains
- Comprehensive DCF Model: Editable template featuring detailed valuation calculations.
- Real-World Data: Avadel Pharmaceuticals plc’s (AVDL) historical and projected financials preloaded for analysis.
- Customizable Parameters: Adjust WACC, growth rates, and tax assumptions to explore various scenarios.
- Financial Statements: Complete annual and quarterly breakdowns for enhanced insights.
- Key Ratios: Integrated analysis for profitability, efficiency, and leverage metrics.
- Dashboard with Visual Outputs: Charts and tables providing clear, actionable results.
Disclaimer
All information, articles, and product details provided on this website are for general informational and educational purposes only. We do not claim any ownership over, nor do we intend to infringe upon, any trademarks, copyrights, logos, brand names, or other intellectual property mentioned or depicted on this site. Such intellectual property remains the property of its respective owners, and any references here are made solely for identification or informational purposes, without implying any affiliation, endorsement, or partnership.
We make no representations or warranties, express or implied, regarding the accuracy, completeness, or suitability of any content or products presented. Nothing on this website should be construed as legal, tax, investment, financial, medical, or other professional advice. In addition, no part of this site—including articles or product references—constitutes a solicitation, recommendation, endorsement, advertisement, or offer to buy or sell any securities, franchises, or other financial instruments, particularly in jurisdictions where such activity would be unlawful.
All content is of a general nature and may not address the specific circumstances of any individual or entity. It is not a substitute for professional advice or services. Any actions you take based on the information provided here are strictly at your own risk. You accept full responsibility for any decisions or outcomes arising from your use of this website and agree to release us from any liability in connection with your use of, or reliance upon, the content or products found herein.