
|
AVepoint, Inc. (AVPT) DCF -Bewertung |
Fully Editable: Tailor To Your Needs In Excel Or Sheets
Professional Design: Trusted, Industry-Standard Templates
Investor-Approved Valuation Models
MAC/PC Compatible, Fully Unlocked
No Expertise Is Needed; Easy To Follow
AvePoint, Inc. (AVPT) Bundle
Vereinfachen Sie die Bewertung der AVepoint, Inc. mit diesem anpassbaren DCF -Taschenrechner! Mit Real AVepoint, Inc. Financials und einstellbaren Prognoseeingaben können Sie Szenarien testen und AVepoint, Inc. in Minuten aufdecken.
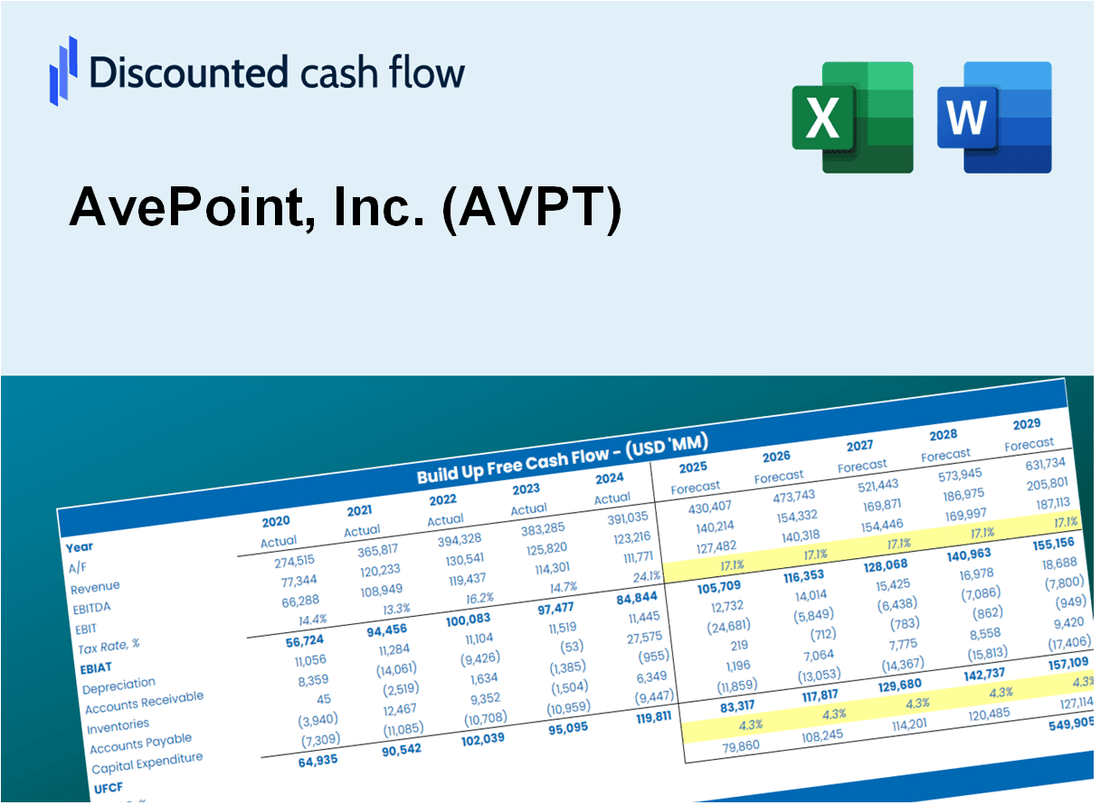
Discounted Cash Flow (DCF) - (USD MM)
| Year | AY1 2020 |
AY2 2021 |
AY3 2022 |
AY4 2023 |
AY5 2024 |
FY1 2025 |
FY2 2026 |
FY3 2027 |
FY4 2028 |
FY5 2029 |
|---|---|---|---|---|---|---|---|---|---|---|
| Revenue | 151.5 | 191.9 | 232.3 | 271.8 | 330.5 | 401.8 | 488.4 | 593.8 | 721.9 | 877.6 |
| Revenue Growth, % | 0 | 26.65 | 21.07 | 16.99 | 21.58 | 21.57 | 21.57 | 21.57 | 21.57 | 21.57 |
| EBITDA | -14.4 | -52.3 | -30.1 | -10.7 | 12.5 | -40.0 | -48.7 | -59.1 | -71.9 | -87.4 |
| EBITDA, % | -9.49 | -27.23 | -12.96 | -3.92 | 3.8 | -9.96 | -9.96 | -9.96 | -9.96 | -9.96 |
| Depreciation | 1.1 | 1.2 | 3.5 | 4.7 | 5.4 | 5.0 | 6.1 | 7.4 | 9.0 | 10.9 |
| Depreciation, % | 0.69886 | 0.6451 | 1.5 | 1.72 | 1.63 | 1.24 | 1.24 | 1.24 | 1.24 | 1.24 |
| EBIT | -15.4 | -53.5 | -33.6 | -15.4 | 7.2 | -45.0 | -54.7 | -66.5 | -80.9 | -98.3 |
| EBIT, % | -10.19 | -27.87 | -14.47 | -5.65 | 2.17 | -11.2 | -11.2 | -11.2 | -11.2 | -11.2 |
| Total Cash | 70.1 | 270.6 | 229.8 | 226.9 | 290.9 | 334.8 | 407.0 | 494.8 | 601.6 | 731.3 |
| Total Cash, percent | .0 | .0 | .0 | .0 | .0 | .0 | .0 | .0 | .0 | .0 |
| Account Receivables | 48.3 | 55.1 | 66.5 | 85.9 | 87.4 | 118.3 | 143.8 | 174.8 | 212.5 | 258.3 |
| Account Receivables, % | 31.84 | 28.69 | 28.61 | 31.59 | 26.44 | 29.43 | 29.43 | 29.43 | 29.43 | 29.43 |
| Inventories | .0 | .0 | .0 | .0 | .0 | .0 | .0 | .0 | .0 | .0 |
| Inventories, % | 0 | 0 | 0 | 0 | 0 | 0 | 0 | 0 | 0 | 0 |
| Accounts Payable | .8 | 1.8 | 1.5 | 1.4 | 2.4 | 2.7 | 3.3 | 4.0 | 4.8 | 5.9 |
| Accounts Payable, % | 0.51078 | 0.95045 | 0.65379 | 0.50915 | 0.71169 | 0.66717 | 0.66717 | 0.66717 | 0.66717 | 0.66717 |
| Capital Expenditure | -1.0 | -2.5 | -5.5 | -3.5 | -3.0 | -5.2 | -6.4 | -7.8 | -9.4 | -11.5 |
| Capital Expenditure, % | -0.6751 | -1.28 | -2.35 | -1.3 | -0.92108 | -1.31 | -1.31 | -1.31 | -1.31 | -1.31 |
| Tax Rate, % | -19.23 | -19.23 | -19.23 | -19.23 | -19.23 | -19.23 | -19.23 | -19.23 | -19.23 | -19.23 |
| EBITAT | -16.5 | -57.5 | -41.6 | -17.9 | 8.5 | -45.0 | -54.7 | -66.5 | -80.9 | -98.3 |
| Depreciation | ||||||||||
| Changes in Account Receivables | ||||||||||
| Changes in Inventories | ||||||||||
| Changes in Accounts Payable | ||||||||||
| Capital Expenditure | ||||||||||
| UFCF | -63.9 | -64.4 | -55.3 | -36.3 | 10.4 | -75.8 | -80.0 | -97.2 | -118.2 | -143.7 |
| WACC, % | 8.8 | 8.8 | 8.8 | 8.8 | 8.8 | 8.8 | 8.8 | 8.8 | 8.8 | 8.8 |
| PV UFCF | ||||||||||
| SUM PV UFCF | -391.3 | |||||||||
| Long Term Growth Rate, % | 2.00 | |||||||||
| Free cash flow (T + 1) | -147 | |||||||||
| Terminal Value | -2,154 | |||||||||
| Present Terminal Value | -1,413 | |||||||||
| Enterprise Value | -1,804 | |||||||||
| Net Debt | -274 | |||||||||
| Equity Value | -1,530 | |||||||||
| Diluted Shares Outstanding, MM | 184 | |||||||||
| Equity Value Per Share | -8.33 |
What You Will Get
- Comprehensive AVPT Financials: Access to historical and projected data for precise valuation.
- Customizable Inputs: Adjust WACC, tax rates, revenue growth, and capital expenditures to fit your analysis.
- Dynamic Calculations: Intrinsic value and NPV are computed in real-time.
- Scenario Analysis: Evaluate various scenarios to assess AvePoint’s future performance.
- User-Friendly Interface: Designed for professionals while remaining approachable for newcomers.
Key Features
- Comprehensive AvePoint Financials: Gain access to precise pre-loaded historical data and future forecasts.
- Tailorable Forecast Assumptions: Modify highlighted fields such as WACC, growth rates, and profit margins.
- Real-Time Calculations: Automatic updates for DCF, Net Present Value (NPV), and cash flow assessments.
- Interactive Dashboard: User-friendly charts and summaries to illustrate your valuation findings.
- Designed for All Levels: An intuitive layout suitable for investors, CFOs, and consultants alike.
How It Works
- Step 1: Download the Excel file.
- Step 2: Review AvePoint's pre-filled financial data and forecasts.
- Step 3: Modify critical inputs like revenue growth, WACC, and tax rates (highlighted cells).
- Step 4: Watch the DCF model update instantly as you tweak assumptions.
- Step 5: Analyze the outputs and use the results for investment decisions.
Why Choose This Calculator for AvePoint, Inc. (AVPT)?
- Designed for Experts: A sophisticated tool tailored for analysts, CFOs, and business consultants.
- Accurate Financial Data: AvePoint’s historical and projected financials are preloaded for precision.
- Flexible Scenario Analysis: Effortlessly simulate various forecasts and assumptions.
- Intuitive Outputs: Automatically computes intrinsic value, NPV, and essential metrics.
- User-Friendly: Comprehensive step-by-step instructions help you navigate the tool easily.
Who Should Use AvePoint, Inc. (AVPT)?
- IT Professionals: Enhance your understanding of data management solutions and their applications.
- Researchers: Utilize AvePoint’s tools to support your studies on cloud migration and data governance.
- Investors: Evaluate your investment strategies and analyze performance metrics for AvePoint, Inc. (AVPT).
- Business Analysts: Optimize your analysis with AvePoint’s robust reporting and analytics features.
- Small Business Owners: Discover how enterprise-level data solutions can benefit your operations.
What the Template Contains
- Operating and Balance Sheet Data: Pre-filled AvePoint historical data and forecasts, including revenue, EBITDA, EBIT, and capital expenditures.
- WACC Calculation: A dedicated sheet for Weighted Average Cost of Capital (WACC), including parameters like Beta, risk-free rate, and share price.
- DCF Valuation (Unlevered and Levered): Editable Discounted Cash Flow models showing intrinsic value with detailed calculations.
- Financial Statements: Pre-loaded financial statements (annual and quarterly) to support analysis.
- Key Ratios: Includes profitability, leverage, and efficiency ratios for AvePoint, Inc. (AVPT).
- Dashboard and Charts: Visual summary of valuation outputs and assumptions to analyze results easily.
Disclaimer
All information, articles, and product details provided on this website are for general informational and educational purposes only. We do not claim any ownership over, nor do we intend to infringe upon, any trademarks, copyrights, logos, brand names, or other intellectual property mentioned or depicted on this site. Such intellectual property remains the property of its respective owners, and any references here are made solely for identification or informational purposes, without implying any affiliation, endorsement, or partnership.
We make no representations or warranties, express or implied, regarding the accuracy, completeness, or suitability of any content or products presented. Nothing on this website should be construed as legal, tax, investment, financial, medical, or other professional advice. In addition, no part of this site—including articles or product references—constitutes a solicitation, recommendation, endorsement, advertisement, or offer to buy or sell any securities, franchises, or other financial instruments, particularly in jurisdictions where such activity would be unlawful.
All content is of a general nature and may not address the specific circumstances of any individual or entity. It is not a substitute for professional advice or services. Any actions you take based on the information provided here are strictly at your own risk. You accept full responsibility for any decisions or outcomes arising from your use of this website and agree to release us from any liability in connection with your use of, or reliance upon, the content or products found herein.