|
Axalta Coating Systems Ltd. (AXTA) DCF -Bewertung |
Fully Editable: Tailor To Your Needs In Excel Or Sheets
Professional Design: Trusted, Industry-Standard Templates
Investor-Approved Valuation Models
MAC/PC Compatible, Fully Unlocked
No Expertise Is Needed; Easy To Follow
Axalta Coating Systems Ltd. (AXTA) Bundle
Verbessern Sie Ihre Anlagestrategien mit dem DCF -Taschenrechner des Axalta Coating Systems Ltd. (AXTA)! Erforschen Sie reale Finanzdaten für Axalta, passen Sie Wachstumsprojektionen und -kosten an und beachten Sie sofort, wie sich diese Modifikationen auf den inneren Wert von (AXTA) auswirken.
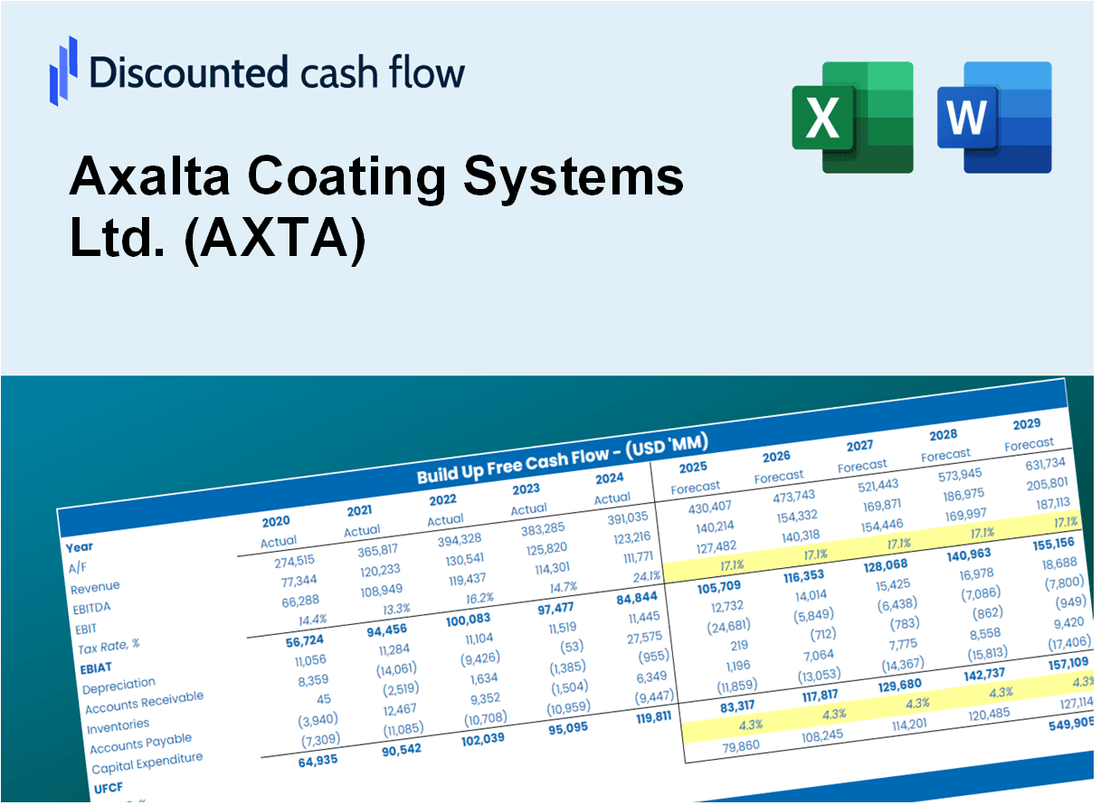
Discounted Cash Flow (DCF) - (USD MM)
| Year | AY1 2020 |
AY2 2021 |
AY3 2022 |
AY4 2023 |
AY5 2024 |
FY1 2025 |
FY2 2026 |
FY3 2027 |
FY4 2028 |
FY5 2029 |
|---|---|---|---|---|---|---|---|---|---|---|
| Revenue | 3,737.6 | 4,416.2 | 4,884.0 | 5,184.0 | 5,276.0 | 5,759.6 | 6,287.6 | 6,863.9 | 7,493.1 | 8,180.0 |
| Revenue Growth, % | 0 | 18.16 | 10.59 | 6.14 | 1.77 | 9.17 | 9.17 | 9.17 | 9.17 | 9.17 |
| EBITDA | 592.4 | 791.2 | 700.0 | 844.0 | 981.0 | 955.8 | 1,043.4 | 1,139.0 | 1,243.4 | 1,357.4 |
| EBITDA, % | 15.85 | 17.92 | 14.33 | 16.28 | 18.59 | 16.59 | 16.59 | 16.59 | 16.59 | 16.59 |
| Depreciation | 320.3 | 316.5 | 303.0 | 276.0 | 280.0 | 375.2 | 409.6 | 447.1 | 488.1 | 532.9 |
| Depreciation, % | 8.57 | 7.17 | 6.2 | 5.32 | 5.31 | 6.51 | 6.51 | 6.51 | 6.51 | 6.51 |
| EBIT | 272.1 | 474.7 | 397.0 | 568.0 | 701.0 | 580.6 | 633.8 | 691.9 | 755.3 | 824.6 |
| EBIT, % | 7.28 | 10.75 | 8.13 | 10.96 | 13.29 | 10.08 | 10.08 | 10.08 | 10.08 | 10.08 |
| Total Cash | 1,360.9 | 840.6 | 645.2 | 700.2 | 593.0 | 1,075.9 | 1,174.6 | 1,282.2 | 1,399.8 | 1,528.1 |
| Total Cash, percent | .0 | .0 | .0 | .0 | .0 | .0 | .0 | .0 | .0 | .0 |
| Account Receivables | 907.0 | 937.5 | 1,067.4 | 1,299.1 | 1,248.0 | 1,337.0 | 1,459.5 | 1,593.3 | 1,739.4 | 1,898.8 |
| Account Receivables, % | 24.27 | 21.23 | 21.86 | 25.06 | 23.65 | 23.21 | 23.21 | 23.21 | 23.21 | 23.21 |
| Inventories | 559.9 | 669.7 | 829.6 | 741.1 | 734.0 | 867.8 | 947.4 | 1,034.2 | 1,129.0 | 1,232.5 |
| Inventories, % | 14.98 | 15.16 | 16.99 | 14.3 | 13.91 | 15.07 | 15.07 | 15.07 | 15.07 | 15.07 |
| Accounts Payable | 564.4 | 657.4 | 733.5 | 665.3 | 603.0 | 797.9 | 871.1 | 950.9 | 1,038.1 | 1,133.2 |
| Accounts Payable, % | 15.1 | 14.89 | 15.02 | 12.83 | 11.43 | 13.85 | 13.85 | 13.85 | 13.85 | 13.85 |
| Capital Expenditure | -82.1 | -121.6 | -150.9 | -137.9 | -140.0 | -153.8 | -167.9 | -183.3 | -200.1 | -218.5 |
| Capital Expenditure, % | -2.2 | -2.75 | -3.09 | -2.66 | -2.65 | -2.67 | -2.67 | -2.67 | -2.67 | -2.67 |
| Tax Rate, % | 21.17 | 21.17 | 21.17 | 21.17 | 21.17 | 21.17 | 21.17 | 21.17 | 21.17 | 21.17 |
| EBITAT | 270.8 | 367.9 | 296.6 | 427.2 | 552.6 | 471.2 | 514.3 | 561.5 | 613.0 | 669.2 |
| Depreciation | ||||||||||
| Changes in Account Receivables | ||||||||||
| Changes in Inventories | ||||||||||
| Changes in Accounts Payable | ||||||||||
| Capital Expenditure | ||||||||||
| UFCF | -393.5 | 515.5 | 235.0 | 353.9 | 688.5 | 664.6 | 627.1 | 684.5 | 747.3 | 815.8 |
| WACC, % | 8.43 | 7.97 | 7.91 | 7.92 | 8 | 8.05 | 8.05 | 8.05 | 8.05 | 8.05 |
| PV UFCF | ||||||||||
| SUM PV UFCF | 2,797.4 | |||||||||
| Long Term Growth Rate, % | 3.50 | |||||||||
| Free cash flow (T + 1) | 844 | |||||||||
| Terminal Value | 18,574 | |||||||||
| Present Terminal Value | 12,615 | |||||||||
| Enterprise Value | 15,412 | |||||||||
| Net Debt | 2,928 | |||||||||
| Equity Value | 12,484 | |||||||||
| Diluted Shares Outstanding, MM | 220 | |||||||||
| Equity Value Per Share | 56.64 |
What You Will Get
- Real AXTA Financial Data: Pre-filled with Axalta's historical and projected data for precise analysis.
- Fully Editable Template: Modify key inputs like revenue growth, WACC, and EBITDA % with ease.
- Automatic Calculations: See Axalta's intrinsic value update instantly based on your changes.
- Professional Valuation Tool: Designed for investors, analysts, and consultants seeking accurate DCF results.
- User-Friendly Design: Simple structure and clear instructions for all experience levels.
Key Features
- Real-Life AXTA Data: Pre-filled with Axalta’s historical financials and future projections.
- Fully Customizable Inputs: Modify revenue growth, profit margins, WACC, tax rates, and capital expenditures.
- Dynamic Valuation Model: Automatic updates to Net Present Value (NPV) and intrinsic value based on your inputs.
- Scenario Testing: Develop multiple forecasting scenarios to explore various valuation outcomes.
- User-Friendly Design: Intuitive, organized, and tailored for both professionals and novices.
How It Works
- Step 1: Download the Excel file.
- Step 2: Review Axalta Coating Systems Ltd.'s pre-filled financial data and forecasts.
- Step 3: Modify critical inputs like revenue growth, WACC, and tax rates (highlighted cells).
- Step 4: Watch the DCF model update instantly as you adjust your assumptions.
- Step 5: Analyze the outputs and leverage the results for investment decisions.
Why Choose Axalta's Tools?
- All-in-One Solution: Combines DCF, WACC, and financial ratio analyses tailored for Axalta Coating Systems Ltd. (AXTA).
- Flexible Parameters: Modify yellow-highlighted fields to explore different financial scenarios.
- In-Depth Analysis: Automatically derives Axalta’s intrinsic value and Net Present Value for informed decision-making.
- Rich Data Repository: Access historical and projected data for reliable baseline evaluations.
- Expert-Level Standards: Perfectly designed for financial analysts, investors, and industry consultants focused on (AXTA).
Who Should Use Axalta Coating Systems Ltd. (AXTA)?
- Paint and Coatings Students: Master the fundamentals of coatings technology and apply them to real-world scenarios.
- Researchers: Utilize advanced models to support studies in materials science and coatings applications.
- Investors: Evaluate your investment strategies and analyze market trends related to Axalta Coating Systems Ltd. (AXTA).
- Industry Analysts: Enhance your analysis with a comprehensive overview of Axalta's market position and performance.
- Manufacturers: Understand how leading companies like Axalta optimize their product offerings and market presence.
What the Template Contains
- Historical Data: Includes Axalta Coating Systems Ltd.'s (AXTA) past financials and baseline forecasts.
- DCF and Levered DCF Models: Detailed templates to calculate Axalta's (AXTA) intrinsic value.
- WACC Sheet: Pre-built calculations for Weighted Average Cost of Capital specific to Axalta (AXTA).
- Editable Inputs: Modify key drivers such as growth rates, EBITDA %, and CAPEX assumptions for Axalta (AXTA).
- Quarterly and Annual Statements: A comprehensive breakdown of Axalta's (AXTA) financials.
- Interactive Dashboard: Visualize valuation results and projections for Axalta (AXTA) dynamically.
Disclaimer
All information, articles, and product details provided on this website are for general informational and educational purposes only. We do not claim any ownership over, nor do we intend to infringe upon, any trademarks, copyrights, logos, brand names, or other intellectual property mentioned or depicted on this site. Such intellectual property remains the property of its respective owners, and any references here are made solely for identification or informational purposes, without implying any affiliation, endorsement, or partnership.
We make no representations or warranties, express or implied, regarding the accuracy, completeness, or suitability of any content or products presented. Nothing on this website should be construed as legal, tax, investment, financial, medical, or other professional advice. In addition, no part of this site—including articles or product references—constitutes a solicitation, recommendation, endorsement, advertisement, or offer to buy or sell any securities, franchises, or other financial instruments, particularly in jurisdictions where such activity would be unlawful.
All content is of a general nature and may not address the specific circumstances of any individual or entity. It is not a substitute for professional advice or services. Any actions you take based on the information provided here are strictly at your own risk. You accept full responsibility for any decisions or outcomes arising from your use of this website and agree to release us from any liability in connection with your use of, or reliance upon, the content or products found herein.