
|
Aytu Biopharma, Inc. (Aytu) DCF -Bewertung |
Fully Editable: Tailor To Your Needs In Excel Or Sheets
Professional Design: Trusted, Industry-Standard Templates
Investor-Approved Valuation Models
MAC/PC Compatible, Fully Unlocked
No Expertise Is Needed; Easy To Follow
Aytu BioPharma, Inc. (AYTU) Bundle
Erforschen Sie das Finanzpotential von Aytu Biopharma, Inc. (AYtu) mit unserem benutzerfreundlichen DCF-Taschenrechner! Geben Sie Ihre Prognosen für Wachstum, Margen und Ausgaben ein, um Aytu Biopharma, Inc. (AYTU) intrinsischer Wert zu berechnen und Ihre Investitionsentscheidungen zu informieren.
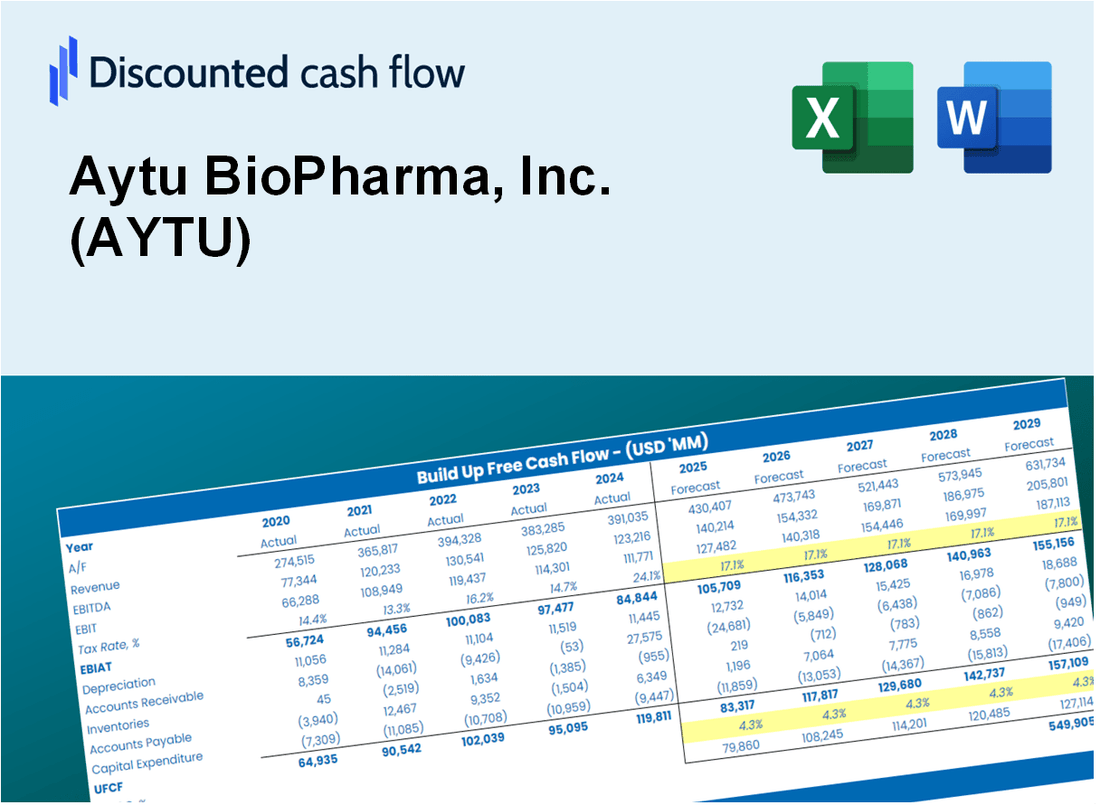
Discounted Cash Flow (DCF) - (USD MM)
| Year | AY1 2021 |
AY2 2022 |
AY3 2023 |
AY4 2024 |
AY5 2025 |
FY1 2026 |
FY2 2027 |
FY3 2028 |
FY4 2029 |
FY5 2030 |
|---|---|---|---|---|---|---|---|---|---|---|
| Revenue | 65.6 | 96.7 | 107.4 | 65.2 | 66.4 | 69.9 | 73.5 | 77.4 | 81.4 | 85.7 |
| Revenue Growth, % | 0 | 47.29 | 11.1 | -39.31 | 1.84 | 5.23 | 5.23 | 5.23 | 5.23 | 5.23 |
| EBITDA | -29.0 | -28.0 | -3.3 | 1.4 | -4.7 | -11.3 | -11.9 | -12.5 | -13.2 | -13.9 |
| EBITDA, % | -44.25 | -28.92 | -3.05 | 2.16 | -7.03 | -16.22 | -16.22 | -16.22 | -16.22 | -16.22 |
| Depreciation | 9.2 | 10.1 | 8.8 | 6.7 | 5.4 | 7.1 | 7.5 | 7.9 | 8.3 | 8.8 |
| Depreciation, % | 14.02 | 10.5 | 8.21 | 10.32 | 8.1 | 10.23 | 10.23 | 10.23 | 10.23 | 10.23 |
| EBIT | -38.2 | -38.1 | -12.1 | -5.3 | -10.0 | -18.5 | -19.4 | -20.5 | -21.5 | -22.7 |
| EBIT, % | -58.26 | -39.42 | -11.26 | -8.16 | -15.13 | -26.44 | -26.44 | -26.44 | -26.44 | -26.44 |
| Total Cash | 49.6 | 19.4 | 23.0 | 20.0 | 31.0 | 27.2 | 28.6 | 30.1 | 31.6 | 33.3 |
| Total Cash, percent | .0 | .0 | .0 | .0 | .0 | .0 | .0 | .0 | .0 | .0 |
| Account Receivables | 28.2 | 21.7 | 28.9 | 23.5 | 31.2 | 24.5 | 25.8 | 27.1 | 28.5 | 30.0 |
| Account Receivables, % | 42.93 | 22.46 | 26.94 | 36.09 | 46.93 | 35.07 | 35.07 | 35.07 | 35.07 | 35.07 |
| Inventories | 16.3 | 10.8 | 12.0 | 12.1 | 11.4 | 11.6 | 12.2 | 12.9 | 13.5 | 14.2 |
| Inventories, % | 24.89 | 11.22 | 11.17 | 18.63 | 17.22 | 16.63 | 16.63 | 16.63 | 16.63 | 16.63 |
| Accounts Payable | 19.3 | 11.0 | 13.5 | 10.3 | 10.6 | 11.9 | 12.5 | 13.2 | 13.8 | 14.6 |
| Accounts Payable, % | 29.34 | 11.37 | 12.55 | 15.82 | 15.97 | 17.01 | 17.01 | 17.01 | 17.01 | 17.01 |
| Capital Expenditure | .0 | .0 | .0 | -.3 | -3.2 | -.7 | -.8 | -.8 | -.9 | -.9 |
| Capital Expenditure, % | 0 | 0 | 0 | -0.50473 | -4.86 | -1.07 | -1.07 | -1.07 | -1.07 | -1.07 |
| Tax Rate, % | 1.33 | 1.33 | 1.33 | 1.33 | 1.33 | 1.33 | 1.33 | 1.33 | 1.33 | 1.33 |
| EBITAT | -38.4 | -38.1 | -12.1 | -8.1 | -9.9 | -18.4 | -19.4 | -20.4 | -21.5 | -22.6 |
| Depreciation | ||||||||||
| Changes in Account Receivables | ||||||||||
| Changes in Inventories | ||||||||||
| Changes in Accounts Payable | ||||||||||
| Capital Expenditure | ||||||||||
| UFCF | -54.5 | -24.2 | -9.2 | .4 | -14.4 | -4.3 | -13.9 | -14.6 | -15.4 | -16.2 |
| WACC, % | 12.12 | 12.11 | 12.12 | 12.12 | 11.99 | 12.1 | 12.1 | 12.1 | 12.1 | 12.1 |
| PV UFCF | ||||||||||
| SUM PV UFCF | -44.2 | |||||||||
| Long Term Growth Rate, % | 2.00 | |||||||||
| Free cash flow (T + 1) | -17 | |||||||||
| Terminal Value | -164 | |||||||||
| Present Terminal Value | -93 | |||||||||
| Enterprise Value | -137 | |||||||||
| Net Debt | -8 | |||||||||
| Equity Value | -129 | |||||||||
| Diluted Shares Outstanding, MM | 6 | |||||||||
| Equity Value Per Share | -20.51 |
What You Will Get
- Real Aytu BioPharma Data: Preloaded financials – from revenue to EBIT – based on actual and projected figures for Aytu BioPharma, Inc. (AYTU).
- Full Customization: Adjust all critical parameters (yellow cells) like WACC, growth %, and tax rates to fit Aytu's specific needs.
- Instant Valuation Updates: Automatic recalculations to analyze the impact of changes on Aytu BioPharma’s fair value.
- Versatile Excel Template: Tailored for quick edits, scenario testing, and detailed projections for Aytu BioPharma, Inc. (AYTU).
- Time-Saving and Accurate: Skip building models from scratch while maintaining precision and flexibility for Aytu BioPharma, Inc. (AYTU).
Key Features
- Real-Life AYTU Data: Pre-filled with Aytu BioPharma’s historical financials and forward-looking projections.
- Fully Customizable Inputs: Adjust revenue growth, margins, WACC, tax rates, and capital expenditures to suit your analysis.
- Dynamic Valuation Model: Automatic updates to Net Present Value (NPV) and intrinsic value based on your customized inputs.
- Scenario Testing: Create multiple forecast scenarios to explore various valuation outcomes.
- User-Friendly Design: Intuitive, structured layout designed for both professionals and newcomers.
How It Works
- 1. Access the Template: Download and open the Excel file containing Aytu BioPharma, Inc.'s (AYTU) preloaded data.
- 2. Adjust Assumptions: Modify essential inputs such as growth projections, WACC, and capital expenditures.
- 3. Instant Results: The DCF model automatically computes intrinsic value and NPV in real-time.
- 4. Explore Scenarios: Evaluate various forecasts to investigate different valuation results.
- 5. Present with Assurance: Deliver expert valuation insights to reinforce your strategic decisions.
Why Choose Aytu BioPharma Calculator?
- Accuracy: Reliable financial data from Aytu BioPharma ensures precise calculations.
- Flexibility: Tailored for users to easily modify and experiment with various inputs.
- Time-Saving: Eliminate the need to create a financial model from the ground up.
- Professional-Grade: Crafted with the expertise and usability expected at the CFO level.
- User-Friendly: Intuitive interface designed for users of all financial backgrounds.
Who Should Use This Product?
- Healthcare Professionals: Understand the latest developments in biopharmaceuticals and their applications.
- Researchers: Utilize data-driven insights to support studies in drug efficacy and market trends.
- Investors: Evaluate investment opportunities and analyze valuation metrics for Aytu BioPharma, Inc. (AYTU).
- Pharmaceutical Analysts: Enhance your analysis with a comprehensive overview of Aytu's product pipeline.
- Entrepreneurs: Learn from Aytu's strategies in navigating the biopharmaceutical landscape.
What the Template Contains
- Historical Data: Includes Aytu BioPharma’s past financials and baseline forecasts.
- DCF and Levered DCF Models: Detailed templates to calculate Aytu BioPharma’s intrinsic value.
- WACC Sheet: Pre-built calculations for Weighted Average Cost of Capital.
- Editable Inputs: Modify key drivers like growth rates, EBITDA %, and CAPEX assumptions.
- Quarterly and Annual Statements: A complete breakdown of Aytu BioPharma’s financials.
- Interactive Dashboard: Visualize valuation results and projections dynamically.
Disclaimer
All information, articles, and product details provided on this website are for general informational and educational purposes only. We do not claim any ownership over, nor do we intend to infringe upon, any trademarks, copyrights, logos, brand names, or other intellectual property mentioned or depicted on this site. Such intellectual property remains the property of its respective owners, and any references here are made solely for identification or informational purposes, without implying any affiliation, endorsement, or partnership.
We make no representations or warranties, express or implied, regarding the accuracy, completeness, or suitability of any content or products presented. Nothing on this website should be construed as legal, tax, investment, financial, medical, or other professional advice. In addition, no part of this site—including articles or product references—constitutes a solicitation, recommendation, endorsement, advertisement, or offer to buy or sell any securities, franchises, or other financial instruments, particularly in jurisdictions where such activity would be unlawful.
All content is of a general nature and may not address the specific circumstances of any individual or entity. It is not a substitute for professional advice or services. Any actions you take based on the information provided here are strictly at your own risk. You accept full responsibility for any decisions or outcomes arising from your use of this website and agree to release us from any liability in connection with your use of, or reliance upon, the content or products found herein.