
|
Azelis Group NV (AZE.BR) DCF -Bewertung |
Fully Editable: Tailor To Your Needs In Excel Or Sheets
Professional Design: Trusted, Industry-Standard Templates
Investor-Approved Valuation Models
MAC/PC Compatible, Fully Unlocked
No Expertise Is Needed; Easy To Follow
Azelis Group NV (AZE.BR) Bundle
Bewerten Sie die finanzielle Aussichten von Azelis Group NV wie ein Experte! Dieser (Azebr) DCF-Taschenrechner liefert vorgefüllte Finanzdaten und ermöglicht Ihnen die Flexibilität, das Umsatzwachstum, WACC, Margen und andere wichtige Annahmen zu ändern, um sich mit Ihren Vorhersagen auszurichten.
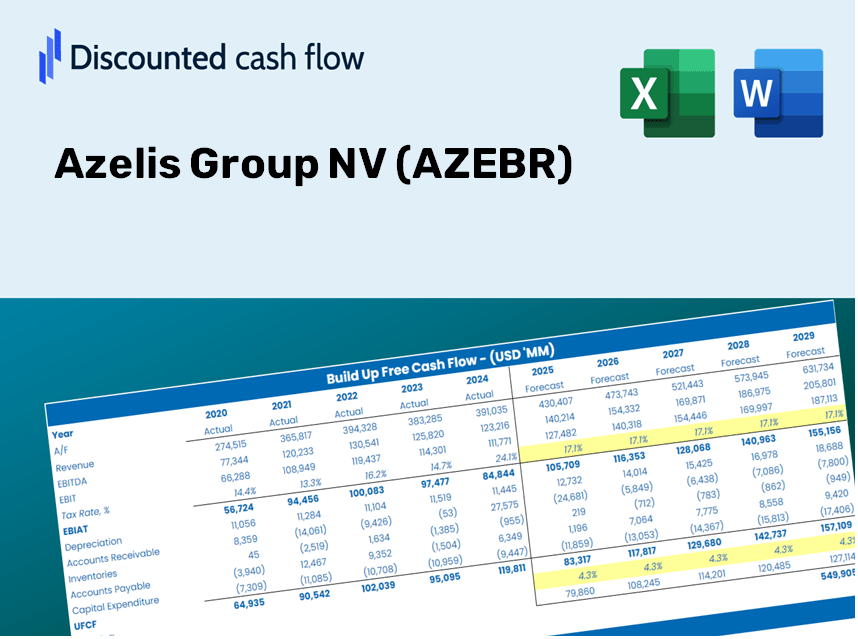
Discounted Cash Flow (DCF) - (USD MM)
| Year | AY1 2020 |
AY2 2021 |
AY3 2022 |
AY4 2023 |
AY5 2024 |
FY1 2025 |
FY2 2026 |
FY3 2027 |
FY4 2028 |
FY5 2029 |
|---|---|---|---|---|---|---|---|---|---|---|
| Revenue | 2,339.0 | 2,827.3 | 4,124.9 | 4,152.2 | 4,238.0 | 4,741.7 | 5,305.4 | 5,936.0 | 6,641.6 | 7,431.1 |
| Revenue Growth, % | 0 | 20.88 | 45.9 | 0.66249 | 2.07 | 11.89 | 11.89 | 11.89 | 11.89 | 11.89 |
| EBITDA | 196.8 | 229.5 | 451.8 | 445.7 | 477.0 | 469.2 | 525.0 | 587.4 | 657.2 | 735.3 |
| EBITDA, % | 8.42 | 8.12 | 10.95 | 10.73 | 11.26 | 9.89 | 9.89 | 9.89 | 9.89 | 9.89 |
| Depreciation | 50.9 | 59.4 | 84.7 | 101.1 | 114.9 | 108.9 | 121.8 | 136.3 | 152.5 | 170.6 |
| Depreciation, % | 2.18 | 2.1 | 2.05 | 2.43 | 2.71 | 2.3 | 2.3 | 2.3 | 2.3 | 2.3 |
| EBIT | 145.9 | 170.1 | 367.0 | 344.6 | 362.1 | 360.3 | 403.2 | 451.1 | 504.7 | 564.7 |
| EBIT, % | 6.24 | 6.02 | 8.9 | 8.3 | 8.54 | 7.6 | 7.6 | 7.6 | 7.6 | 7.6 |
| Total Cash | 163.5 | 142.8 | 268.4 | 484.9 | 304.5 | 354.8 | 397.0 | 444.2 | 497.0 | 556.1 |
| Total Cash, percent | .0 | .0 | .0 | .0 | .0 | .0 | .0 | .0 | .0 | .0 |
| Account Receivables | 260.6 | 433.4 | .0 | 444.9 | 589.0 | 484.5 | 542.0 | 606.5 | 678.6 | 759.2 |
| Account Receivables, % | 11.14 | 15.33 | 0 | 10.71 | 13.9 | 10.22 | 10.22 | 10.22 | 10.22 | 10.22 |
| Inventories | 267.8 | 467.5 | 627.7 | 562.8 | 677.9 | 689.9 | 772.0 | 863.7 | 966.4 | 1,081.3 |
| Inventories, % | 11.45 | 16.53 | 15.22 | 13.55 | 16 | 14.55 | 14.55 | 14.55 | 14.55 | 14.55 |
| Accounts Payable | 237.0 | 368.7 | 462.7 | 434.1 | 486.8 | 534.2 | 597.7 | 668.7 | 748.2 | 837.2 |
| Accounts Payable, % | 10.13 | 13.04 | 11.22 | 10.45 | 11.49 | 11.27 | 11.27 | 11.27 | 11.27 | 11.27 |
| Capital Expenditure | -12.1 | -18.3 | -18.4 | -15.5 | -13.9 | -21.9 | -24.5 | -27.4 | -30.7 | -34.3 |
| Capital Expenditure, % | -0.51612 | -0.64684 | -0.44711 | -0.37293 | -0.32744 | -0.46209 | -0.46209 | -0.46209 | -0.46209 | -0.46209 |
| Tax Rate, % | 29.45 | 29.45 | 29.45 | 29.45 | 29.45 | 29.45 | 29.45 | 29.45 | 29.45 | 29.45 |
| EBITAT | 112.7 | 95.9 | 248.7 | 247.7 | 255.5 | 247.7 | 277.2 | 310.1 | 347.0 | 388.3 |
| Depreciation | ||||||||||
| Changes in Account Receivables | ||||||||||
| Changes in Inventories | ||||||||||
| Changes in Accounts Payable | ||||||||||
| Capital Expenditure | ||||||||||
| UFCF | -139.9 | -103.8 | 682.2 | -75.3 | 149.9 | 474.7 | 298.4 | 333.8 | 373.5 | 417.9 |
| WACC, % | 6.05 | 5.35 | 5.73 | 5.87 | 5.83 | 5.77 | 5.77 | 5.77 | 5.77 | 5.77 |
| PV UFCF | ||||||||||
| SUM PV UFCF | 1,611.9 | |||||||||
| Long Term Growth Rate, % | 3.00 | |||||||||
| Free cash flow (T + 1) | 430 | |||||||||
| Terminal Value | 15,566 | |||||||||
| Present Terminal Value | 11,761 | |||||||||
| Enterprise Value | 13,373 | |||||||||
| Net Debt | 1,540 | |||||||||
| Equity Value | 11,833 | |||||||||
| Diluted Shares Outstanding, MM | 244 | |||||||||
| Equity Value Per Share | 48.54 |
Your Benefits with Azelis Group NV (AZEBR)
- Pre-Filled Financial Model: Utilize Azelis Group NV's real data for accurate DCF valuation.
- Complete Forecasting Control: Modify revenue growth, profit margins, WACC, and other essential variables.
- Real-Time Calculations: Automatic updates provide immediate feedback as you make adjustments.
- Professional-Grade Template: An expertly crafted Excel file for high-quality valuation purposes.
- Versatile and Customizable: Designed for adaptability, allowing repeated utilization for comprehensive forecasts.
Key Features
- Comprehensive Azelis Financial Data: Gain access to precise historical figures and future forecasts tailored for Azelis Group NV (AZEBR).
- Flexible Forecast Customization: Modify highlighted fields, including WACC, growth rates, and profit margins.
- Real-Time Calculations: Experience automatic updates for DCF, Net Present Value (NPV), and cash flow evaluations.
- User-Friendly Dashboard: Visualize your valuation outcomes with clear charts and concise summaries.
- Designed for All Users: An accessible layout suited for investors, CFOs, and consultants, regardless of their expertise.
How It Works
- 1. Access the Template: Download and open the Excel file featuring Azelis Group NV’s (AZEBR) preloaded data.
- 2. Modify Key Inputs: Adjust important parameters such as growth rates, WACC, and capital expenditures.
- 3. See Instant Results: The DCF model automatically calculates intrinsic value and NPV in real-time.
- 4. Experiment with Scenarios: Evaluate various forecasts to explore different valuation results.
- 5. Present with Assurance: Deliver professional valuation analyses to inform your decisions.
Why Opt for the Azelis Group NV (AZEBR) Calculator?
- Precision: Utilizes actual Azelis Group NV financial data to ensure accuracy.
- Versatility: Tailored for users to easily experiment with and adjust inputs.
- Efficiency: Eliminate the need to construct a DCF model from the ground up.
- Expert-Level: Created with the attention to detail expected from CFOs.
- Accessible: Designed to be straightforward, even for those with minimal financial modeling expertise.
Who Can Benefit from Azelis Group NV (AZEBR)?
- Individual Investors: Gain insights to make educated decisions regarding the purchase or sale of Azelis Group NV (AZEBR) shares.
- Financial Analysts: Enhance your valuation workflows with ready-to-implement financial models specific to Azelis Group NV (AZEBR).
- Consultants: Provide clients with timely and precise valuation analysis related to Azelis Group NV (AZEBR).
- Business Owners: Learn how major corporations like Azelis Group NV (AZEBR) are valued to inform your own business strategies.
- Finance Students: Explore valuation methodologies using data and case studies from Azelis Group NV (AZEBR).
Contents of the Template
- Pre-Filled DCF Model: Azelis Group NV’s financial data preloaded for immediate access.
- WACC Calculator: Comprehensive calculations for Weighted Average Cost of Capital.
- Financial Ratios: Assess Azelis Group NV's profitability, leverage, and operational efficiency.
- Editable Inputs: Adjust parameters like growth rates, profit margins, and CAPEX to match your scenarios.
- Financial Statements: Annual and quarterly reports provided for thorough analysis.
- Interactive Dashboard: Easily visualize essential valuation metrics and outcomes.
Disclaimer
All information, articles, and product details provided on this website are for general informational and educational purposes only. We do not claim any ownership over, nor do we intend to infringe upon, any trademarks, copyrights, logos, brand names, or other intellectual property mentioned or depicted on this site. Such intellectual property remains the property of its respective owners, and any references here are made solely for identification or informational purposes, without implying any affiliation, endorsement, or partnership.
We make no representations or warranties, express or implied, regarding the accuracy, completeness, or suitability of any content or products presented. Nothing on this website should be construed as legal, tax, investment, financial, medical, or other professional advice. In addition, no part of this site—including articles or product references—constitutes a solicitation, recommendation, endorsement, advertisement, or offer to buy or sell any securities, franchises, or other financial instruments, particularly in jurisdictions where such activity would be unlawful.
All content is of a general nature and may not address the specific circumstances of any individual or entity. It is not a substitute for professional advice or services. Any actions you take based on the information provided here are strictly at your own risk. You accept full responsibility for any decisions or outcomes arising from your use of this website and agree to release us from any liability in connection with your use of, or reliance upon, the content or products found herein.