
|
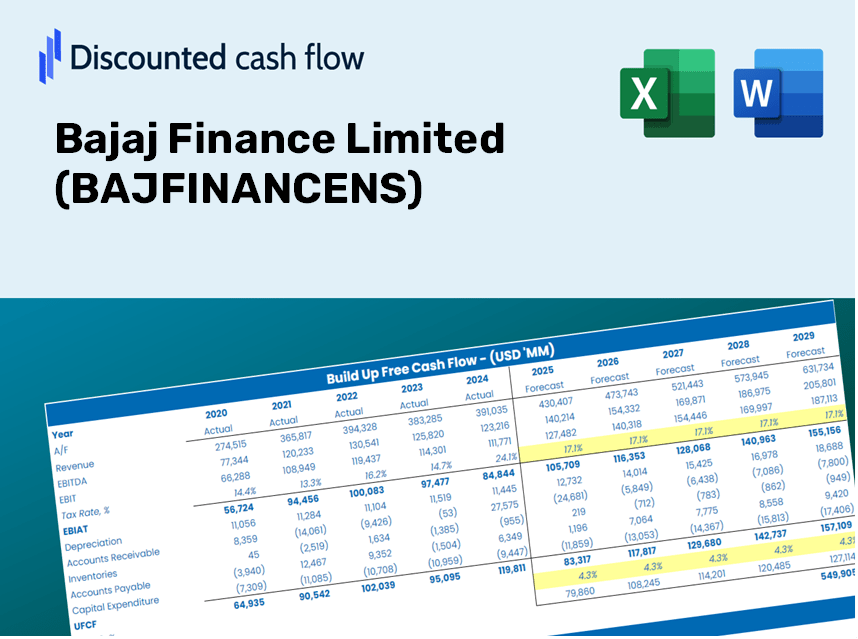
Bajaj Finance Limited (Bajfinance.NS) DCF -Bewertung |
Fully Editable: Tailor To Your Needs In Excel Or Sheets
Professional Design: Trusted, Industry-Standard Templates
Investor-Approved Valuation Models
MAC/PC Compatible, Fully Unlocked
No Expertise Is Needed; Easy To Follow
Bajaj Finance Limited (BAJFINANCE.NS) Bundle
Egal, ob Sie ein Investor oder Analyst sind, dieser (Bajfinancens) DCF -Taschenrechner ist die perfekte Ressource für eine genaue Bewertung. Mit echten Daten von Bajaj Finance Limited geladen, können Sie Ihre Prognosen anpassen und die Auswirkungen sofort beobachten.
What You Will Get
- Pre-Filled Financial Model: Utilize Bajaj Finance Limited’s actual data for accurate DCF valuation.
- Full Forecast Control: Customize revenue growth, margins, WACC, and other essential drivers.
- Instant Calculations: Real-time updates ensure you see results as you modify inputs.
- Investor-Ready Template: A polished Excel file crafted for top-tier valuation processes.
- Customizable and Reusable: Designed for adaptability, allowing repeated application for comprehensive forecasts.
Key Features
- Advanced DCF Calculator: Offers comprehensive unlevered and levered DCF valuation models tailored for Bajaj Finance Limited.
- WACC Calculator: Features a pre-structured Weighted Average Cost of Capital sheet with customizable input options.
- Editable Forecast Assumptions: Adjust growth rates, capital expenditures, and discount rates as needed.
- Built-In Financial Ratios: Evaluate profitability, leverage, and efficiency ratios for Bajaj Finance Limited (BAJFINANCENS).
- Dashboard and Charts: Visual representations provide a summary of key valuation metrics for straightforward analysis.
How It Works
- Download the Template: Gain instant access to the Excel-based BAJFINANCENS DCF Calculator.
- Input Your Assumptions: Modify the yellow-highlighted cells for growth rates, WACC, margins, and additional variables.
- Instant Calculations: The model will automatically update the intrinsic value of Bajaj Finance Limited.
- Test Scenarios: Experiment with various assumptions to analyze potential changes in valuation.
- Analyze and Decide: Use the outcomes to inform your investment or financial analysis decisions.
Why Choose This Calculator for Bajaj Finance Limited (BAJFINANCENS)?
- Designed for Experts: A sophisticated tool favored by financial analysts, CFOs, and consultants.
- Accurate Data: Bajaj Finance's historical and projected financials are pre-loaded for precise analysis.
- Flexible Scenario Analysis: Effortlessly simulate various forecasts and assumptions.
- Transparent Results: Automatically computes intrinsic value, NPV, and vital financial metrics.
- User-Friendly: Comprehensive step-by-step instructions guide you through each stage.
Who Should Use This Product?
- Investors: Accurately assess the fair value of Bajaj Finance Limited (BAJFINANCENS) before making investment choices.
- CFOs: Utilize a professional-grade DCF model for comprehensive financial reporting and analysis.
- Consultants: Efficiently customize the template for client valuation reports.
- Entrepreneurs: Acquire insights into financial modeling utilized by leading corporations.
- Educators: Employ it as a teaching resource to illustrate valuation techniques.
Contents of the Template
- Comprehensive DCF Model: An editable template featuring detailed valuation calculations.
- Real-World Data: Bajaj Finance Limited’s (BAJFINANCENS) historical and projected financials preloaded for your analysis.
- Customizable Parameters: Modify WACC, growth rates, and tax assumptions to explore different scenarios.
- Financial Statements: Complete annual and quarterly breakdowns for enhanced insights.
- Key Ratios: Integrated analysis for assessing profitability, efficiency, and leverage.
- Dashboard with Visual Outputs: Visual charts and tables providing clear and actionable results.
Disclaimer
All information, articles, and product details provided on this website are for general informational and educational purposes only. We do not claim any ownership over, nor do we intend to infringe upon, any trademarks, copyrights, logos, brand names, or other intellectual property mentioned or depicted on this site. Such intellectual property remains the property of its respective owners, and any references here are made solely for identification or informational purposes, without implying any affiliation, endorsement, or partnership.
We make no representations or warranties, express or implied, regarding the accuracy, completeness, or suitability of any content or products presented. Nothing on this website should be construed as legal, tax, investment, financial, medical, or other professional advice. In addition, no part of this site—including articles or product references—constitutes a solicitation, recommendation, endorsement, advertisement, or offer to buy or sell any securities, franchises, or other financial instruments, particularly in jurisdictions where such activity would be unlawful.
All content is of a general nature and may not address the specific circumstances of any individual or entity. It is not a substitute for professional advice or services. Any actions you take based on the information provided here are strictly at your own risk. You accept full responsibility for any decisions or outcomes arising from your use of this website and agree to release us from any liability in connection with your use of, or reliance upon, the content or products found herein.