
|
Ball Corporation (Ball) DCF -Bewertung |
Fully Editable: Tailor To Your Needs In Excel Or Sheets
Professional Design: Trusted, Industry-Standard Templates
Investor-Approved Valuation Models
MAC/PC Compatible, Fully Unlocked
No Expertise Is Needed; Easy To Follow
Ball Corporation (BALL) Bundle
Gewinnen Sie Einblicke in die Bewertungsanalyse in Ihrer Ball Corporation (Ball) mit unserem ausgefeilten DCF -Taschenrechner! Diese Excel -Vorlage wird mit realen (Ball-) Daten vorinstalliert, sodass Sie Prognosen und Annahmen anpassen können, um die inneren Wert der Ball Corporation genau zu bestimmen.
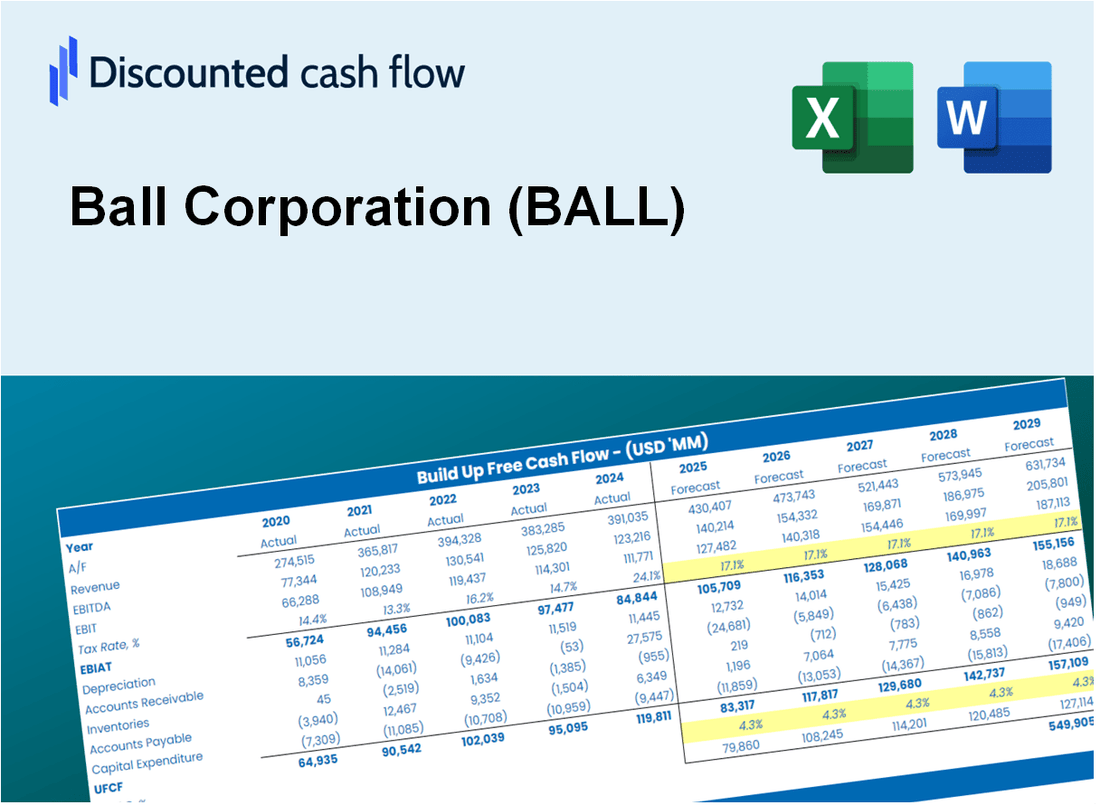
Discounted Cash Flow (DCF) - (USD MM)
| Year | AY1 2020 |
AY2 2021 |
AY3 2022 |
AY4 2023 |
AY5 2024 |
FY1 2025 |
FY2 2026 |
FY3 2027 |
FY4 2028 |
FY5 2029 |
|---|---|---|---|---|---|---|---|---|---|---|
| Revenue | 11,758.0 | 13,932.0 | 15,290.0 | 12,019.0 | 11,798.0 | 11,945.6 | 12,095.1 | 12,246.4 | 12,399.7 | 12,554.8 |
| Revenue Growth, % | 0 | 18.49 | 9.75 | -21.39 | -1.84 | 1.25 | 1.25 | 1.25 | 1.25 | 1.25 |
| EBITDA | 1,622.0 | 1,976.0 | 1,881.0 | 1,760.0 | 1,459.0 | 1,607.6 | 1,627.8 | 1,648.1 | 1,668.8 | 1,689.6 |
| EBITDA, % | 13.79 | 14.18 | 12.3 | 14.64 | 12.37 | 13.46 | 13.46 | 13.46 | 13.46 | 13.46 |
| Depreciation | 668.0 | 700.0 | 672.0 | 686.0 | 620.0 | 622.7 | 630.5 | 638.4 | 646.4 | 654.4 |
| Depreciation, % | 5.68 | 5.02 | 4.4 | 5.71 | 5.26 | 5.21 | 5.21 | 5.21 | 5.21 | 5.21 |
| EBIT | 954.0 | 1,276.0 | 1,209.0 | 1,074.0 | 839.0 | 985.0 | 997.3 | 1,009.8 | 1,022.4 | 1,035.2 |
| EBIT, % | 8.11 | 9.16 | 7.91 | 8.94 | 7.11 | 8.25 | 8.25 | 8.25 | 8.25 | 8.25 |
| Total Cash | 1,366.0 | 563.0 | 548.0 | 695.0 | 893.0 | 778.7 | 788.5 | 798.3 | 808.3 | 818.4 |
| Total Cash, percent | .0 | .0 | .0 | .0 | .0 | .0 | .0 | .0 | .0 | .0 |
| Account Receivables | 1,738.0 | 2,560.0 | 2,594.0 | 2,057.0 | 2,166.0 | 2,045.0 | 2,070.6 | 2,096.5 | 2,122.7 | 2,149.3 |
| Account Receivables, % | 14.78 | 18.37 | 16.97 | 17.11 | 18.36 | 17.12 | 17.12 | 17.12 | 17.12 | 17.12 |
| Inventories | 1,353.0 | 1,795.0 | 2,179.0 | 1,531.0 | 1,477.0 | 1,526.6 | 1,545.7 | 1,565.1 | 1,584.7 | 1,604.5 |
| Inventories, % | 11.51 | 12.88 | 14.25 | 12.74 | 12.52 | 12.78 | 12.78 | 12.78 | 12.78 | 12.78 |
| Accounts Payable | 3,430.0 | 4,759.0 | 4,383.0 | 3,661.0 | 3,418.0 | 3,617.8 | 3,663.1 | 3,708.9 | 3,755.3 | 3,802.3 |
| Accounts Payable, % | 29.17 | 34.16 | 28.67 | 30.46 | 28.97 | 30.29 | 30.29 | 30.29 | 30.29 | 30.29 |
| Capital Expenditure | -1,113.0 | -1,726.0 | -1,651.0 | -1,045.0 | -484.0 | -1,085.8 | -1,099.4 | -1,113.2 | -1,127.1 | -1,141.2 |
| Capital Expenditure, % | -9.47 | -12.39 | -10.8 | -8.69 | -4.1 | -9.09 | -9.09 | -9.09 | -9.09 | -9.09 |
| Tax Rate, % | -611.9 | -611.9 | -611.9 | -611.9 | -611.9 | -611.9 | -611.9 | -611.9 | -611.9 | -611.9 |
| EBITAT | 819.5 | 1,083.5 | 975.6 | 1,197.7 | 5,972.8 | 889.4 | 900.6 | 911.8 | 923.2 | 934.8 |
| Depreciation | ||||||||||
| Changes in Account Receivables | ||||||||||
| Changes in Inventories | ||||||||||
| Changes in Accounts Payable | ||||||||||
| Capital Expenditure | ||||||||||
| UFCF | 713.5 | 122.5 | -797.4 | 1,301.7 | 5,810.8 | 697.5 | 432.2 | 437.6 | 443.1 | 448.6 |
| WACC, % | 7.69 | 7.67 | 7.61 | 7.89 | 7.89 | 7.75 | 7.75 | 7.75 | 7.75 | 7.75 |
| PV UFCF | ||||||||||
| SUM PV UFCF | 2,006.9 | |||||||||
| Long Term Growth Rate, % | 3.50 | |||||||||
| Free cash flow (T + 1) | 464 | |||||||||
| Terminal Value | 10,924 | |||||||||
| Present Terminal Value | 7,522 | |||||||||
| Enterprise Value | 9,528 | |||||||||
| Net Debt | 5,124 | |||||||||
| Equity Value | 4,404 | |||||||||
| Diluted Shares Outstanding, MM | 308 | |||||||||
| Equity Value Per Share | 14.29 |
What You Will Receive
- Customizable Excel Template: A fully adaptable Excel-based DCF Calculator featuring pre-filled real BALL financials.
- Actual Data: Historical figures and forward-looking projections (as indicated in the highlighted cells).
- Forecasting Flexibility: Modify forecast assumptions such as revenue growth, EBITDA %, and WACC.
- Instant Calculations: Quickly observe the effects of your inputs on Ball Corporation’s valuation.
- Professional Resource: Designed for investors, CFOs, consultants, and financial analysts.
- User-Friendly Layout: Organized for clarity and ease of navigation, complete with step-by-step guidance.
Key Features
- Customizable Financial Inputs: Adjust essential metrics such as revenue growth, EBITDA %, and capital expenditures for Ball Corporation (BALL).
- Instant DCF Valuation: Quickly computes intrinsic value, NPV, and other financial outputs for Ball Corporation (BALL).
- High-Precision Accuracy: Leverages Ball Corporation’s real-world financial data for credible valuation results.
- Effortless Scenario Analysis: Evaluate various assumptions and analyze results with ease for Ball Corporation (BALL).
- Efficiency Booster: Streamline the valuation process without the hassle of creating complex models from the ground up for Ball Corporation (BALL).
How It Works
- Download the Template: Gain immediate access to the Excel-based BALL DCF Calculator.
- Input Your Assumptions: Modify the yellow-highlighted cells for growth rates, WACC, margins, and more.
- Instant Calculations: The model automatically refreshes Ball Corporation's intrinsic value.
- Test Scenarios: Experiment with various assumptions to assess potential valuation fluctuations.
- Analyze and Decide: Utilize the outcomes to inform your investment or financial analysis.
Why Choose This Calculator for Ball Corporation (BALL)?
- Accuracy: Utilizes real Ball Corporation financial data for precise calculations.
- Flexibility: Allows users to easily test and adjust inputs as needed.
- Time-Saving: Eliminate the complexity of constructing a DCF model from the ground up.
- Professional-Grade: Crafted with the expertise and precision expected at the CFO level.
- User-Friendly: Intuitive interface suitable for users with varying levels of financial modeling skills.
Who Should Use This Product?
- Investors: Accurately assess Ball Corporation’s fair value before making investment decisions.
- CFOs: Utilize a professional-grade DCF model for financial reporting and analysis specific to Ball Corporation (BALL).
- Consultants: Easily customize the template for valuation reports tailored to clients interested in Ball Corporation (BALL).
- Entrepreneurs: Discover insights into financial modeling practices utilized by leading companies like Ball Corporation (BALL).
- Educators: Employ it as a teaching resource to illustrate valuation methodologies relevant to Ball Corporation (BALL).
What the Template Contains
- Pre-Filled Data: Includes Ball Corporation’s historical financials and forecasts.
- Discounted Cash Flow Model: Editable DCF valuation model with automatic calculations.
- Weighted Average Cost of Capital (WACC): A dedicated sheet for calculating WACC based on custom inputs.
- Key Financial Ratios: Analyze Ball Corporation’s profitability, efficiency, and leverage.
- Customizable Inputs: Edit revenue growth, margins, and tax rates with ease.
- Clear Dashboard: Charts and tables summarizing key valuation results.
Disclaimer
All information, articles, and product details provided on this website are for general informational and educational purposes only. We do not claim any ownership over, nor do we intend to infringe upon, any trademarks, copyrights, logos, brand names, or other intellectual property mentioned or depicted on this site. Such intellectual property remains the property of its respective owners, and any references here are made solely for identification or informational purposes, without implying any affiliation, endorsement, or partnership.
We make no representations or warranties, express or implied, regarding the accuracy, completeness, or suitability of any content or products presented. Nothing on this website should be construed as legal, tax, investment, financial, medical, or other professional advice. In addition, no part of this site—including articles or product references—constitutes a solicitation, recommendation, endorsement, advertisement, or offer to buy or sell any securities, franchises, or other financial instruments, particularly in jurisdictions where such activity would be unlawful.
All content is of a general nature and may not address the specific circumstances of any individual or entity. It is not a substitute for professional advice or services. Any actions you take based on the information provided here are strictly at your own risk. You accept full responsibility for any decisions or outcomes arising from your use of this website and agree to release us from any liability in connection with your use of, or reliance upon, the content or products found herein.