
|
Bandwidth Inc. (Band) DCF -Bewertung |
Fully Editable: Tailor To Your Needs In Excel Or Sheets
Professional Design: Trusted, Industry-Standard Templates
Investor-Approved Valuation Models
MAC/PC Compatible, Fully Unlocked
No Expertise Is Needed; Easy To Follow
Bandwidth Inc. (BAND) Bundle
Bewerten Sie die finanziellen Aussichten von Bandwidth Inc. wie ein Experte! Dieser (Band-) DCF-Taschenrechner bietet vorgefüllte Finanzdaten und vollständige Flexibilität, um Annahmen wie Umsatzwachstum, WACC, Margen und andere kritische Faktoren zu ändern, die mit Ihren Projektionen übereinstimmen.
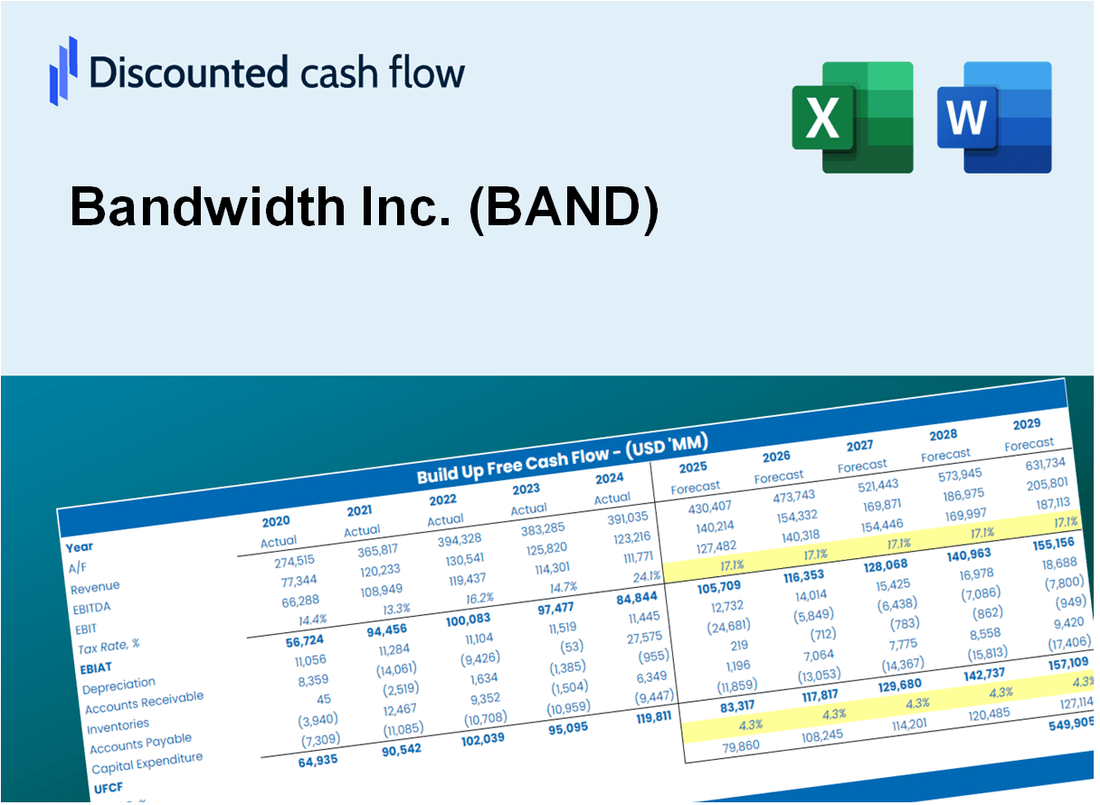
Discounted Cash Flow (DCF) - (USD MM)
| Year | AY1 2020 |
AY2 2021 |
AY3 2022 |
AY4 2023 |
AY5 2024 |
FY1 2025 |
FY2 2026 |
FY3 2027 |
FY4 2028 |
FY5 2029 |
|---|---|---|---|---|---|---|---|---|---|---|
| Revenue | 343.1 | 490.9 | 573.2 | 601.1 | 748.5 | 915.4 | 1,119.6 | 1,369.4 | 1,674.8 | 2,048.4 |
| Revenue Growth, % | 0 | 43.07 | 16.75 | 4.88 | 24.52 | 22.31 | 22.31 | 22.31 | 22.31 | 22.31 |
| EBITDA | 8.1 | 39.8 | 62.9 | 32.5 | 42.2 | 59.5 | 72.8 | 89.0 | 108.9 | 133.2 |
| EBITDA, % | 2.36 | 8.11 | 10.98 | 5.41 | 5.63 | 6.5 | 6.5 | 6.5 | 6.5 | 6.5 |
| Depreciation | 21.6 | 42.4 | 42.6 | 51.0 | 49.2 | 68.5 | 83.8 | 102.5 | 125.4 | 153.3 |
| Depreciation, % | 6.3 | 8.63 | 7.43 | 8.49 | 6.58 | 7.49 | 7.49 | 7.49 | 7.49 | 7.49 |
| EBIT | -13.5 | -2.5 | 20.4 | -18.5 | -7.1 | -9.0 | -11.0 | -13.5 | -16.5 | -20.2 |
| EBIT, % | -3.94 | -0.51619 | 3.55 | -3.08 | -0.94751 | -0.98505 | -0.98505 | -0.98505 | -0.98505 | -0.98505 |
| Total Cash | 112.2 | 331.5 | 184.9 | 153.5 | 83.8 | 309.8 | 378.9 | 463.4 | 566.7 | 693.1 |
| Total Cash, percent | .0 | .0 | .0 | .0 | .0 | .0 | .0 | .0 | .0 | .0 |
| Account Receivables | 55.2 | 61.6 | 74.5 | 78.2 | 86.5 | 121.2 | 148.2 | 181.3 | 221.7 | 271.2 |
| Account Receivables, % | 16.1 | 12.54 | 12.99 | 13 | 11.55 | 13.24 | 13.24 | 13.24 | 13.24 | 13.24 |
| Inventories | .0 | .0 | .0 | .0 | .0 | .0 | .0 | .0 | .0 | .0 |
| Inventories, % | 0 | 0 | 0 | 0 | 0 | 0 | 0 | 0 | 0 | 0 |
| Accounts Payable | 11.7 | 9.1 | 26.8 | 34.2 | 28.4 | 35.5 | 43.5 | 53.2 | 65.0 | 79.5 |
| Accounts Payable, % | 3.4 | 1.86 | 4.67 | 5.69 | 3.79 | 3.88 | 3.88 | 3.88 | 3.88 | 3.88 |
| Capital Expenditure | -14.6 | -54.6 | -64.1 | -19.9 | -14.0 | -58.1 | -71.1 | -86.9 | -106.3 | -130.0 |
| Capital Expenditure, % | -4.25 | -11.13 | -11.18 | -3.31 | -1.87 | -6.35 | -6.35 | -6.35 | -6.35 | -6.35 |
| Tax Rate, % | 27.13 | 27.13 | 27.13 | 27.13 | 27.13 | 27.13 | 27.13 | 27.13 | 27.13 | 27.13 |
| EBITAT | -20.5 | -2.2 | 23.0 | -15.7 | -5.2 | -8.0 | -9.8 | -12.0 | -14.7 | -18.0 |
| Depreciation | ||||||||||
| Changes in Account Receivables | ||||||||||
| Changes in Inventories | ||||||||||
| Changes in Accounts Payable | ||||||||||
| Capital Expenditure | ||||||||||
| UFCF | -57.1 | -23.3 | 6.2 | 19.3 | 15.9 | -25.2 | -16.2 | -19.8 | -24.2 | -29.6 |
| WACC, % | 8.08 | 7.82 | 8.08 | 7.76 | 7.51 | 7.85 | 7.85 | 7.85 | 7.85 | 7.85 |
| PV UFCF | ||||||||||
| SUM PV UFCF | -91.3 | |||||||||
| Long Term Growth Rate, % | 4.00 | |||||||||
| Free cash flow (T + 1) | -31 | |||||||||
| Terminal Value | -800 | |||||||||
| Present Terminal Value | -548 | |||||||||
| Enterprise Value | -640 | |||||||||
| Net Debt | 422 | |||||||||
| Equity Value | -1,062 | |||||||||
| Diluted Shares Outstanding, MM | 27 | |||||||||
| Equity Value Per Share | -39.01 |
What You Will Get
- Accurate BAND Financials: Access to historical and projected data for precise valuation.
- Customizable Inputs: Adjust WACC, tax rates, revenue growth, and capital expenditures as needed.
- Dynamic Calculations: Intrinsic value and NPV are computed in real-time.
- Scenario Analysis: Evaluate various scenarios to assess Bandwidth Inc.’s future performance.
- User-Friendly Design: Designed for professionals while remaining approachable for newcomers.
Key Features
- Customizable Usage Metrics: Adjust key inputs such as call volume, pricing models, and operational costs.
- Instant Usage Valuation: Provides immediate calculations for service value, ROI, and other essential metrics.
- High-Precision Analytics: Leverages Bandwidth Inc.’s (BAND) actual performance data for accurate valuation results.
- Effortless Scenario Testing: Easily evaluate various assumptions and assess their impacts on outcomes.
- Efficiency Booster: Skip the complexities of building intricate analysis frameworks from the ground up.
How It Works
- 1. Access the Template: Download and open the Excel file featuring Bandwidth Inc.'s (BAND) preloaded data.
- 2. Modify Assumptions: Adjust key parameters such as growth rates, WACC, and capital expenditures.
- 3. View Results Immediately: The DCF model automatically calculates intrinsic value and NPV in real-time.
- 4. Explore Scenarios: Analyze various forecasts to evaluate different valuation results.
- 5. Present with Assurance: Share professional valuation insights to back your strategic decisions.
Why Choose This Calculator for Bandwidth Inc. (BAND)?
- User-Friendly Interface: Crafted for both novices and seasoned analysts.
- Customizable Inputs: Adjust parameters effortlessly to suit your evaluation needs.
- Real-Time Adjustments: Monitor immediate changes to Bandwidth Inc.'s valuation as you tweak inputs.
- Preloaded Data: Comes with Bandwidth Inc.'s actual financial metrics for swift assessments.
- Relied Upon by Experts: A preferred tool among investors and analysts for making strategic decisions.
Who Should Use This Product?
- Investors: Evaluate Bandwidth Inc.'s (BAND) performance and make informed trading decisions.
- CFOs and Financial Analysts: Optimize valuation methodologies and assess financial forecasts for Bandwidth Inc. (BAND).
- Startup Founders: Understand the valuation strategies of leading tech companies like Bandwidth Inc. (BAND).
- Consultants: Provide comprehensive valuation analyses and reports for clients interested in Bandwidth Inc. (BAND).
- Students and Educators: Utilize current data on Bandwidth Inc. (BAND) to practice and teach valuation principles.
What the Template Contains
- Operating and Balance Sheet Data: Pre-filled Bandwidth Inc. (BAND) historical data and forecasts, including revenue, EBITDA, EBIT, and capital expenditures.
- WACC Calculation: A dedicated sheet for Weighted Average Cost of Capital (WACC), including parameters like Beta, risk-free rate, and share price.
- DCF Valuation (Unlevered and Levered): Editable Discounted Cash Flow models showing intrinsic value with detailed calculations.
- Financial Statements: Pre-loaded financial statements (annual and quarterly) to support analysis.
- Key Ratios: Includes profitability, leverage, and efficiency ratios for Bandwidth Inc. (BAND).
- Dashboard and Charts: Visual summary of valuation outputs and assumptions to analyze results easily.
Disclaimer
All information, articles, and product details provided on this website are for general informational and educational purposes only. We do not claim any ownership over, nor do we intend to infringe upon, any trademarks, copyrights, logos, brand names, or other intellectual property mentioned or depicted on this site. Such intellectual property remains the property of its respective owners, and any references here are made solely for identification or informational purposes, without implying any affiliation, endorsement, or partnership.
We make no representations or warranties, express or implied, regarding the accuracy, completeness, or suitability of any content or products presented. Nothing on this website should be construed as legal, tax, investment, financial, medical, or other professional advice. In addition, no part of this site—including articles or product references—constitutes a solicitation, recommendation, endorsement, advertisement, or offer to buy or sell any securities, franchises, or other financial instruments, particularly in jurisdictions where such activity would be unlawful.
All content is of a general nature and may not address the specific circumstances of any individual or entity. It is not a substitute for professional advice or services. Any actions you take based on the information provided here are strictly at your own risk. You accept full responsibility for any decisions or outcomes arising from your use of this website and agree to release us from any liability in connection with your use of, or reliance upon, the content or products found herein.