
|
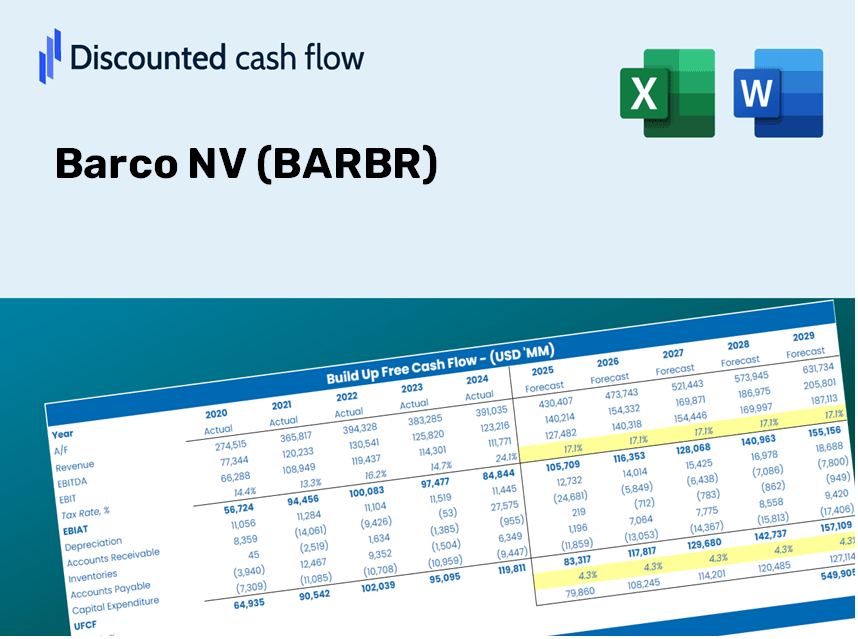
Barco NV (Bar.BR) DCF -Bewertung |
Fully Editable: Tailor To Your Needs In Excel Or Sheets
Professional Design: Trusted, Industry-Standard Templates
Investor-Approved Valuation Models
MAC/PC Compatible, Fully Unlocked
No Expertise Is Needed; Easy To Follow
Barco NV (BAR.BR) Bundle
Vereinfachen Sie die Bewertung der Barco NV (BARBR) mit diesem anpassbaren DCF -Taschenrechner! Unter Verwendung von Real Barco NV (BARBR) -Befinanzierungen und einstellbaren Prognoseeingaben können Sie Szenarien testen und Barco NV (BARB) -Fair -Wert in Minuten aufdecken.
What You Will Gain
- Real BARBR Financial Data: Pre-loaded with Barco NV’s historical and projected figures for accurate analysis.
- Fully Customizable Template: Easily adjust key inputs such as revenue growth, WACC, and EBITDA percentage.
- Instant Calculations: Watch Barco NV’s intrinsic value update in real-time as you make changes.
- Professional Valuation Tool: Tailored for investors, analysts, and consultants pursuing precise DCF results.
- User-Friendly Interface: Intuitive design and straightforward instructions suitable for all skill levels.
Notable Features
- Accurate Financial Data for Barco NV (BARBR): Gain access to precise pre-loaded historical figures and future forecasts.
- Adjustable Forecast Parameters: Modify the highlighted yellow cells, including WACC, growth rates, and profit margins.
- Real-Time Calculations: Automatic refresh of DCF, Net Present Value (NPV), and cash flow assessments.
- User-Friendly Dashboard: Clear charts and summaries to help visualize your valuation insights.
- Suitable for All Skill Levels: An intuitive design tailored for investors, CFOs, and consultants alike.
How It Operates
- Download: Obtain the ready-to-use Excel file featuring Barco NV’s financial data.
- Customize: Modify forecasts such as revenue growth, EBITDA %, and WACC.
- Update Automatically: The intrinsic value and NPV calculations refresh in real-time.
- Test Scenarios: Develop various projections and immediately compare results.
- Make Decisions: Utilize the valuation results to shape your investment strategy.
Why Opt for This Calculator?
- Precise Information: Accurate Barco NV financials provide trustworthy valuation outcomes.
- Tailorable: Modify essential metrics like growth projections, WACC, and tax rates to align with your forecasts.
- Efficient: Pre-configured calculations save you from building from the ground up.
- Professional-Quality Tool: Crafted for investors, analysts, and consultants alike.
- User-Friendly: Easy-to-navigate design and step-by-step guidance ensure accessibility for all users.
Who Can Benefit from This Product?
- Institutional Investors: Develop comprehensive and dependable valuation models for portfolio assessments related to Barco NV (BARBR).
- Corporate Finance Departments: Evaluate valuation scenarios to inform strategic decisions within their organizations.
- Consultants and Financial Advisors: Equip clients with precise valuation insights for Barco NV (BARBR) stock.
- Students and Instructors: Utilize real-time data to practice and educate on financial modeling techniques.
- Tech Aficionados: Gain insights into the valuation processes of technology companies like Barco NV (BARBR) in the marketplace.
What the Template Includes
- Pre-Filled DCF Model: Barco NV’s financial data preloaded for immediate application.
- WACC Calculator: Comprehensive calculations for Weighted Average Cost of Capital.
- Financial Ratios: Assess Barco NV’s profitability, leverage, and efficiency.
- Editable Inputs: Adjust assumptions such as growth, margins, and CAPEX to suit your scenarios.
- Financial Statements: Annual and quarterly reports to facilitate in-depth analysis.
- Interactive Dashboard: Effortlessly visualize key valuation metrics and outcomes.
Disclaimer
All information, articles, and product details provided on this website are for general informational and educational purposes only. We do not claim any ownership over, nor do we intend to infringe upon, any trademarks, copyrights, logos, brand names, or other intellectual property mentioned or depicted on this site. Such intellectual property remains the property of its respective owners, and any references here are made solely for identification or informational purposes, without implying any affiliation, endorsement, or partnership.
We make no representations or warranties, express or implied, regarding the accuracy, completeness, or suitability of any content or products presented. Nothing on this website should be construed as legal, tax, investment, financial, medical, or other professional advice. In addition, no part of this site—including articles or product references—constitutes a solicitation, recommendation, endorsement, advertisement, or offer to buy or sell any securities, franchises, or other financial instruments, particularly in jurisdictions where such activity would be unlawful.
All content is of a general nature and may not address the specific circumstances of any individual or entity. It is not a substitute for professional advice or services. Any actions you take based on the information provided here are strictly at your own risk. You accept full responsibility for any decisions or outcomes arising from your use of this website and agree to release us from any liability in connection with your use of, or reliance upon, the content or products found herein.