
|
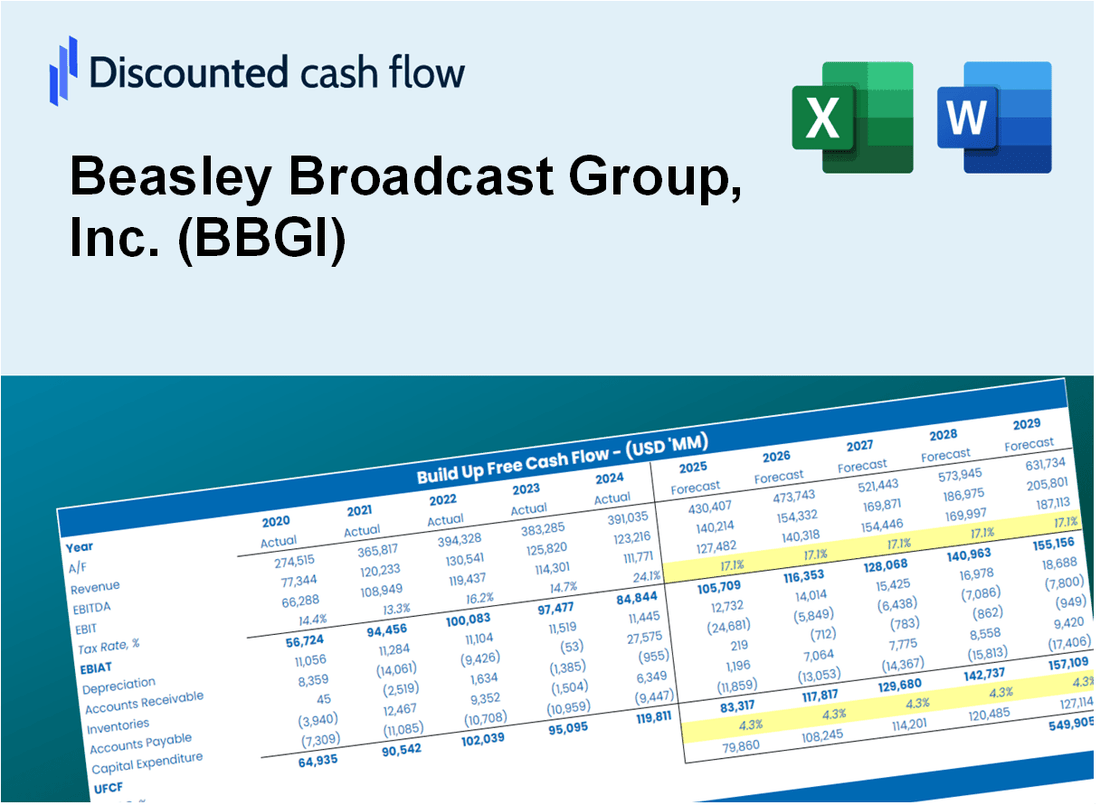
DCF -Bewertung von Beasley Broadcast Group, Inc. (BBGI) |
Fully Editable: Tailor To Your Needs In Excel Or Sheets
Professional Design: Trusted, Industry-Standard Templates
Investor-Approved Valuation Models
MAC/PC Compatible, Fully Unlocked
No Expertise Is Needed; Easy To Follow
Beasley Broadcast Group, Inc. (BBGI) Bundle
Bewerten Sie die Finanzaussichten der Beasley Broadcast Group, Inc. (BBGI) wie ein Experte! Dieser (BBGI) DCF-Taschenrechner bietet Ihnen vorgefüllte Finanzdaten und bietet gleichzeitig die volle Flexibilität, um das Umsatzwachstum, WACC, Margen und andere wichtige Annahmen zu ändern, um sich an Ihren Projektionen auszurichten.
What You Will Get
- Real Beasley Broadcast Data: Preloaded financials – from revenue to EBIT – based on actual and projected figures for Beasley Broadcast Group, Inc. (BBGI).
- Full Customization: Adjust all critical parameters (yellow cells) like WACC, growth %, and tax rates tailored for BBGI.
- Instant Valuation Updates: Automatic recalculations to analyze the impact of changes on Beasley Broadcast Group’s fair value.
- Versatile Excel Template: Designed for quick edits, scenario testing, and detailed projections specific to BBGI.
- Time-Saving and Accurate: Skip building models from scratch while ensuring precision and flexibility for Beasley Broadcast Group, Inc. (BBGI).
Key Features
- Accurate BBGI Financial Data: Gain access to reliable pre-loaded historical metrics and future forecasts.
- Adjustable Forecast Parameters: Modify highlighted cells for variables like WACC, growth rates, and profit margins.
- Real-Time Calculations: Instant updates for DCF, Net Present Value (NPV), and cash flow assessments.
- Insightful Visual Dashboard: User-friendly charts and summaries to help you interpret your valuation findings.
- Designed for All Users: An intuitive layout tailored for investors, CFOs, and consultants, whether seasoned or new.
How It Works
- Step 1: Download the Excel file.
- Step 2: Review pre-entered Beasley Broadcast Group, Inc. (BBGI) data (historical and projected).
- Step 3: Adjust key assumptions (yellow cells) based on your analysis.
- Step 4: View automatic recalculations for Beasley Broadcast Group, Inc. (BBGI)’s intrinsic value.
- Step 5: Use the outputs for investment decisions or reporting.
Why Choose This Calculator?
- User-Friendly Interface: Perfect for both novices and seasoned professionals.
- Customizable Inputs: Adjust parameters easily to suit your financial analysis.
- Real-Time Adjustments: Observe immediate changes to Beasley Broadcast Group’s valuation as you tweak inputs.
- Preloaded Data: Comes with Beasley Broadcast Group’s (BBGI) actual financial figures for swift evaluations.
- Relied Upon by Experts: Utilized by investors and analysts for making well-informed decisions.
Who Should Use This Product?
- Investors: Accurately assess Beasley Broadcast Group, Inc.'s (BBGI) fair value prior to making investment choices.
- CFOs: Utilize a professional-grade DCF model for comprehensive financial reporting and analysis.
- Consultants: Efficiently customize the template for valuation reports tailored to clients.
- Entrepreneurs: Acquire insights into financial modeling techniques employed by leading media companies.
- Educators: Implement it as a teaching resource to illustrate valuation methods.
What the Template Contains
- Pre-Filled DCF Model: Beasley Broadcast Group, Inc.’s (BBGI) financial data preloaded for immediate use.
- WACC Calculator: Detailed calculations for Weighted Average Cost of Capital.
- Financial Ratios: Evaluate Beasley Broadcast Group, Inc.’s (BBGI) profitability, leverage, and efficiency.
- Editable Inputs: Change assumptions such as growth, margins, and CAPEX to fit your scenarios.
- Financial Statements: Annual and quarterly reports to support detailed analysis.
- Interactive Dashboard: Easily visualize key valuation metrics and results.
Disclaimer
All information, articles, and product details provided on this website are for general informational and educational purposes only. We do not claim any ownership over, nor do we intend to infringe upon, any trademarks, copyrights, logos, brand names, or other intellectual property mentioned or depicted on this site. Such intellectual property remains the property of its respective owners, and any references here are made solely for identification or informational purposes, without implying any affiliation, endorsement, or partnership.
We make no representations or warranties, express or implied, regarding the accuracy, completeness, or suitability of any content or products presented. Nothing on this website should be construed as legal, tax, investment, financial, medical, or other professional advice. In addition, no part of this site—including articles or product references—constitutes a solicitation, recommendation, endorsement, advertisement, or offer to buy or sell any securities, franchises, or other financial instruments, particularly in jurisdictions where such activity would be unlawful.
All content is of a general nature and may not address the specific circumstances of any individual or entity. It is not a substitute for professional advice or services. Any actions you take based on the information provided here are strictly at your own risk. You accept full responsibility for any decisions or outcomes arising from your use of this website and agree to release us from any liability in connection with your use of, or reliance upon, the content or products found herein.