
|
BBGI Global Infrastructure S.A. (BBGI.L) DCF -Bewertung |
Fully Editable: Tailor To Your Needs In Excel Or Sheets
Professional Design: Trusted, Industry-Standard Templates
Investor-Approved Valuation Models
MAC/PC Compatible, Fully Unlocked
No Expertise Is Needed; Easy To Follow
BBGI Global Infrastructure S.A. (BBGI.L) Bundle
Entdecken Sie das wahre Potenzial von BBGI Global Infrastructure S.A. (BBGIL) mit unserem fortschrittlichen DCF -Taschenrechner! Passen Sie wesentliche Annahmen an, erkunden Sie verschiedene Szenarien und bewerten Sie die Auswirkungen verschiedener Variablen auf die Bewertung von BBGI - alles innerhalb einer bequemen Excel -Vorlage.
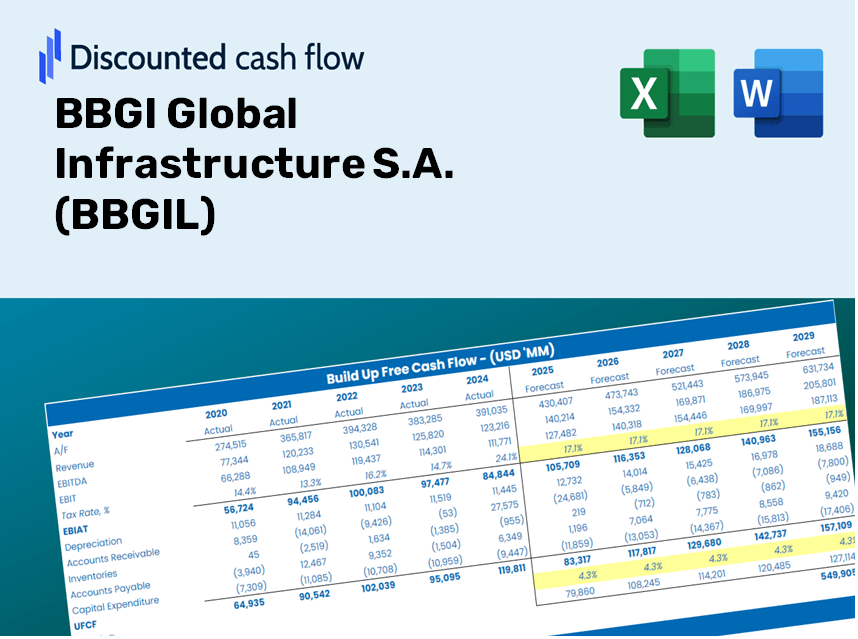
Discounted Cash Flow (DCF) - (USD MM)
| Year | AY1 2020 |
AY2 2021 |
AY3 2022 |
AY4 2023 |
AY5 2024 |
FY1 2025 |
FY2 2026 |
FY3 2027 |
FY4 2028 |
FY5 2029 |
|---|---|---|---|---|---|---|---|---|---|---|
| Revenue | 55.6 | 72.5 | 134.9 | 48.1 | 42.4 | 46.6 | 51.3 | 56.5 | 62.1 | 68.4 |
| Revenue Growth, % | 0 | 30.32 | 86.11 | -64.34 | -11.92 | 10.04 | 10.04 | 10.04 | 10.04 | 10.04 |
| EBITDA | 50.2 | 67.1 | 137.7 | 37.3 | .0 | 33.6 | 37.0 | 40.7 | 44.8 | 49.3 |
| EBITDA, % | 90.27 | 92.52 | 102.12 | 77.59 | 0 | 72.07 | 72.07 | 72.07 | 72.07 | 72.07 |
| Depreciation | .0 | .0 | .0 | .0 | .2 | .1 | .1 | .1 | .1 | .1 |
| Depreciation, % | 0.04854893 | 0.03173508 | 0.02520666 | 0.0914799 | 0.44375 | 0.12814 | 0.12814 | 0.12814 | 0.12814 | 0.12814 |
| EBIT | 50.2 | 67.0 | 137.7 | 37.3 | -.2 | 33.5 | 36.9 | 40.6 | 44.7 | 49.2 |
| EBIT, % | 90.22 | 92.48 | 102.09 | 77.5 | -0.44375 | 71.95 | 71.95 | 71.95 | 71.95 | 71.95 |
| Total Cash | 20.5 | 26.9 | 31.2 | 9.7 | 27.4 | 17.0 | 18.7 | 20.5 | 22.6 | 24.9 |
| Total Cash, percent | .0 | .0 | .0 | .0 | .0 | .0 | .0 | .0 | .0 | .0 |
| Account Receivables | 1.6 | 1.0 | .9 | .9 | 1.1 | .9 | 1.0 | 1.1 | 1.2 | 1.3 |
| Account Receivables, % | 2.93 | 1.41 | 0.67391 | 1.8 | 2.6 | 1.88 | 1.88 | 1.88 | 1.88 | 1.88 |
| Inventories | -4.0 | -2.7 | -4.8 | .0 | .0 | -1.4 | -1.5 | -1.6 | -1.8 | -2.0 |
| Inventories, % | -7.27 | -3.71 | -3.55 | 0 | 0 | -2.91 | -2.91 | -2.91 | -2.91 | -2.91 |
| Accounts Payable | 2.7 | 3.0 | 3.2 | 2.7 | 2.9 | 2.2 | 2.4 | 2.7 | 2.9 | 3.2 |
| Accounts Payable, % | 4.88 | 4.08 | 2.4 | 5.61 | 6.76 | 4.75 | 4.75 | 4.75 | 4.75 | 4.75 |
| Capital Expenditure | .0 | .0 | -.1 | .0 | .0 | .0 | .0 | .0 | .0 | .0 |
| Capital Expenditure, % | -0.0431546 | -0.04553294 | -0.06598213 | -0.02910724 | 0 | -0.03675538 | -0.03675538 | -0.03675538 | -0.03675538 | -0.03675538 |
| Tax Rate, % | 6.97 | 6.97 | 6.97 | 6.97 | 6.97 | 6.97 | 6.97 | 6.97 | 6.97 | 6.97 |
| EBITAT | 47.2 | 64.0 | 133.8 | 34.5 | -.2 | 31.7 | 34.9 | 38.4 | 42.2 | 46.5 |
| Depreciation | ||||||||||
| Changes in Account Receivables | ||||||||||
| Changes in Inventories | ||||||||||
| Changes in Accounts Payable | ||||||||||
| Capital Expenditure | ||||||||||
| UFCF | 52.3 | 63.5 | 136.2 | 29.2 | -.1 | 32.7 | 35.2 | 38.7 | 42.6 | 46.9 |
| WACC, % | 6.25 | 6.25 | 6.25 | 6.25 | 6.25 | 6.25 | 6.25 | 6.25 | 6.25 | 6.25 |
| PV UFCF | ||||||||||
| SUM PV UFCF | 162.2 | |||||||||
| Long Term Growth Rate, % | 2.00 | |||||||||
| Free cash flow (T + 1) | 48 | |||||||||
| Terminal Value | 1,125 | |||||||||
| Present Terminal Value | 831 | |||||||||
| Enterprise Value | 993 | |||||||||
| Net Debt | -27 | |||||||||
| Equity Value | 1,020 | |||||||||
| Diluted Shares Outstanding, MM | 716 | |||||||||
| Equity Value Per Share | 142.44 |
Benefits You Will Receive
- Comprehensive BBGIL Financial Data: Includes BBGI Global Infrastructure’s historical and forecasted figures for accurate analysis.
- Customizable Template: Easily adjust essential inputs such as revenue growth, WACC, and EBITDA %.
- Instant Calculations: Watch as BBGI’s intrinsic value recalculates automatically with your adjustments.
- Expert Valuation Tool: Tailored for investors, analysts, and consultants in search of reliable DCF outcomes.
- Intuitive Design: User-friendly layout with straightforward guidance suitable for all skill levels.
Key Features
- Comprehensive DCF Calculator: Offers detailed unlevered and levered DCF valuation models tailored for BBGI Global Infrastructure S.A. (BBGIL).
- WACC Calculator: Comes with a pre-defined Weighted Average Cost of Capital sheet featuring customizable inputs for precise assessments.
- Customizable Forecast Assumptions: Adjust growth rates, capital expenditures, and discount rates to fit your investment strategy.
- Integrated Financial Ratios: Evaluate profitability, leverage, and efficiency ratios specifically for BBGI Global Infrastructure S.A. (BBGIL).
- Interactive Dashboard and Charts: Visual presentations of key valuation metrics simplify analysis and decision-making.
How It Operates
- 1. Access the Template: Download and open the Excel file featuring BBGI Global Infrastructure S.A.’s (BBGIL) preloaded data.
- 2. Modify Inputs: Adjust critical parameters such as growth rates, WACC, and capital expenditures to fit your analysis.
- 3. Get Instant Results: The DCF model automatically computes intrinsic value and NPV based on your inputs.
- 4. Explore Various Scenarios: Analyze different valuation outcomes by comparing multiple forecasts.
- 5. Present with Assurance: Deliver professional valuation insights to strengthen your decision-making process.
Why Opt for This Calculator?
- Crafted for Experts: A sophisticated tool designed for analysts, CFOs, and consultants in the infrastructure sector.
- Accurate Data: Historical and projected financials for BBGI Global Infrastructure S.A. (BBGIL) preloaded for precision.
- Forecast Scenarios: Effortlessly model various forecasts and assumptions to see potential outcomes.
- Comprehensive Outputs: Instantly calculates intrinsic value, NPV, and other essential metrics.
- User-Friendly: Detailed step-by-step guidelines to help you navigate the tool with ease.
Who Can Benefit from This Product?
- Investors: Assess BBGI Global Infrastructure S.A. (BBGIL) valuation to inform stock trading decisions.
- CFOs and Financial Analysts: Optimize valuation methodologies and evaluate financial forecasts.
- Startup Founders: Gain insights into how large infrastructure firms like BBGI are valued.
- Consultants: Produce comprehensive valuation reports for their clientele.
- Students and Educators: Utilize real-world examples to practice and teach valuation principles.
Contents of the Template
- Comprehensive DCF Model: Editable template featuring detailed valuation calculations.
- Real-World Data: BBGI Global Infrastructure S.A.'s historical and projected financials preloaded for in-depth analysis.
- Customizable Parameters: Modify WACC, growth rates, and tax assumptions to explore various scenarios.
- Financial Statements: Complete annual and quarterly breakdowns for enhanced insights.
- Key Ratios: Built-in analysis of profitability, efficiency, and leverage metrics.
- Dashboard with Visual Outputs: Charts and tables designed for clear, actionable results.
Disclaimer
All information, articles, and product details provided on this website are for general informational and educational purposes only. We do not claim any ownership over, nor do we intend to infringe upon, any trademarks, copyrights, logos, brand names, or other intellectual property mentioned or depicted on this site. Such intellectual property remains the property of its respective owners, and any references here are made solely for identification or informational purposes, without implying any affiliation, endorsement, or partnership.
We make no representations or warranties, express or implied, regarding the accuracy, completeness, or suitability of any content or products presented. Nothing on this website should be construed as legal, tax, investment, financial, medical, or other professional advice. In addition, no part of this site—including articles or product references—constitutes a solicitation, recommendation, endorsement, advertisement, or offer to buy or sell any securities, franchises, or other financial instruments, particularly in jurisdictions where such activity would be unlawful.
All content is of a general nature and may not address the specific circumstances of any individual or entity. It is not a substitute for professional advice or services. Any actions you take based on the information provided here are strictly at your own risk. You accept full responsibility for any decisions or outcomes arising from your use of this website and agree to release us from any liability in connection with your use of, or reliance upon, the content or products found herein.