
|
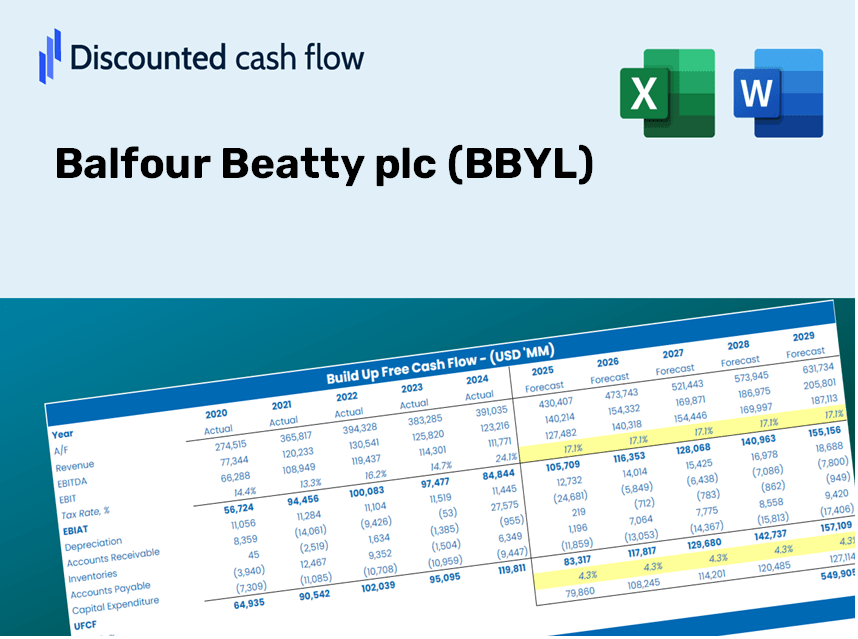
Balfour Beatty Plc (BBY.L) DCF -Bewertung |
Fully Editable: Tailor To Your Needs In Excel Or Sheets
Professional Design: Trusted, Industry-Standard Templates
Investor-Approved Valuation Models
MAC/PC Compatible, Fully Unlocked
No Expertise Is Needed; Easy To Follow
Balfour Beatty plc (BBY.L) Bundle
Bewerten Sie die finanziellen Aussichten von Balfour Beatty Plc wie ein Experte! Dieser DCF-Taschenrechner (BGYL) bietet vorgefüllte Finanzdaten und bietet Ihnen die Freiheit, das Umsatzwachstum, WACC, Margen und andere wesentliche Annahmen zu ändern, um sich an Ihren Vorhersagen auszurichten.
What You'll Receive
- Authentic BBYL Financial Data: Preloaded with Balfour Beatty’s historical and projected figures for accurate analysis.
- Completely Customizable Template: Effortlessly adjust key inputs such as revenue growth, WACC, and EBITDA %.
- Instant Calculations: Watch as Balfour Beatty’s intrinsic value updates immediately based on your adjustments.
- Expert Valuation Tool: Tailored for investors, analysts, and consultants aiming for precise DCF results.
- Intuitive Design: Straightforward layout and clear instructions suitable for all skill levels.
Key Features
- Comprehensive DCF Calculator: Features both unlevered and levered DCF valuation models for in-depth analysis.
- WACC Calculator: A pre-configured Weighted Average Cost of Capital sheet with adjustable inputs for tailored calculations.
- Customizable Forecast Assumptions: Alter growth rates, capital expenditures, and discount rates based on your projections.
- Integrated Financial Ratios: Evaluate profitability, leverage, and efficiency ratios specifically for Balfour Beatty plc (BBYL).
- Interactive Dashboard and Charts: Visual representations present key valuation metrics for straightforward analysis.
How It Works
- Step 1: Download the prebuilt Excel template with Balfour Beatty plc’s (BBYL) data included.
- Step 2: Review the pre-filled sheets to familiarize yourself with the key metrics.
- Step 3: Modify forecasts and assumptions in the editable yellow cells (WACC, growth, margins).
- Step 4: Instantly see the recalculated results, including Balfour Beatty plc’s (BBYL) intrinsic value.
- Step 5: Use the outputs to make informed investment decisions or create detailed reports.
Why Choose This Calculator?
- Accurate Data: Access to authentic Balfour Beatty plc (BBYL) financial information ensures dependable valuation outcomes.
- Customizable: Tailor essential parameters such as growth rates, WACC, and tax rates to align with your forecasts.
- Time-Saving: Built-in calculations save you the hassle of starting from scratch.
- Professional-Grade Tool: Crafted for investors, financial analysts, and consultants.
- User-Friendly: Easy-to-navigate layout and step-by-step guidance cater to users of all experience levels.
Who Can Benefit from Balfour Beatty plc (BBYL)?
- Investors: Enhance your investment strategies with an industry-leading valuation tool.
- Financial Analysts: Streamline your workflow with a customizable DCF model at your fingertips.
- Consultants: Effortlessly tailor the template for impactful client presentations or comprehensive reports.
- Finance Enthusiasts: Expand your knowledge of valuation methodologies through practical, real-life scenarios.
- Educators and Students: Utilize this resource as an invaluable teaching aid in finance courses.
Contents of the Template
- Comprehensive DCF Model: Editable template featuring detailed valuation calculations tailored for Balfour Beatty plc (BBYL).
- Real-World Data: Balfour Beatty's historical and projected financials preloaded for in-depth analysis.
- Customizable Parameters: Modify WACC, growth rates, and tax assumptions to explore various scenarios.
- Financial Statements: Complete annual and quarterly breakdowns for enhanced insights.
- Key Ratios: Integrated analysis of profitability, efficiency, and leverage metrics.
- Dashboard with Visual Outputs: Charts and tables that provide clear, actionable results specific to Balfour Beatty plc (BBYL).
Disclaimer
All information, articles, and product details provided on this website are for general informational and educational purposes only. We do not claim any ownership over, nor do we intend to infringe upon, any trademarks, copyrights, logos, brand names, or other intellectual property mentioned or depicted on this site. Such intellectual property remains the property of its respective owners, and any references here are made solely for identification or informational purposes, without implying any affiliation, endorsement, or partnership.
We make no representations or warranties, express or implied, regarding the accuracy, completeness, or suitability of any content or products presented. Nothing on this website should be construed as legal, tax, investment, financial, medical, or other professional advice. In addition, no part of this site—including articles or product references—constitutes a solicitation, recommendation, endorsement, advertisement, or offer to buy or sell any securities, franchises, or other financial instruments, particularly in jurisdictions where such activity would be unlawful.
All content is of a general nature and may not address the specific circumstances of any individual or entity. It is not a substitute for professional advice or services. Any actions you take based on the information provided here are strictly at your own risk. You accept full responsibility for any decisions or outcomes arising from your use of this website and agree to release us from any liability in connection with your use of, or reliance upon, the content or products found herein.