
|
Strahlglobal (Beem) DCF -Bewertung |
Fully Editable: Tailor To Your Needs In Excel Or Sheets
Professional Design: Trusted, Industry-Standard Templates
Investor-Approved Valuation Models
MAC/PC Compatible, Fully Unlocked
No Expertise Is Needed; Easy To Follow
Beam Global (BEEM) Bundle
Vereinfachen Sie die Bewertung der Beam Global (Beem) mit diesem anpassbaren DCF -Taschenrechner! Mit Real Beam Global (BEEM-) Finanzdaten und einstellbaren Prognoseeingängen können Sie Szenarien testen und den beizulegenden Zeitwert (BEEM) in Minuten aufdecken.
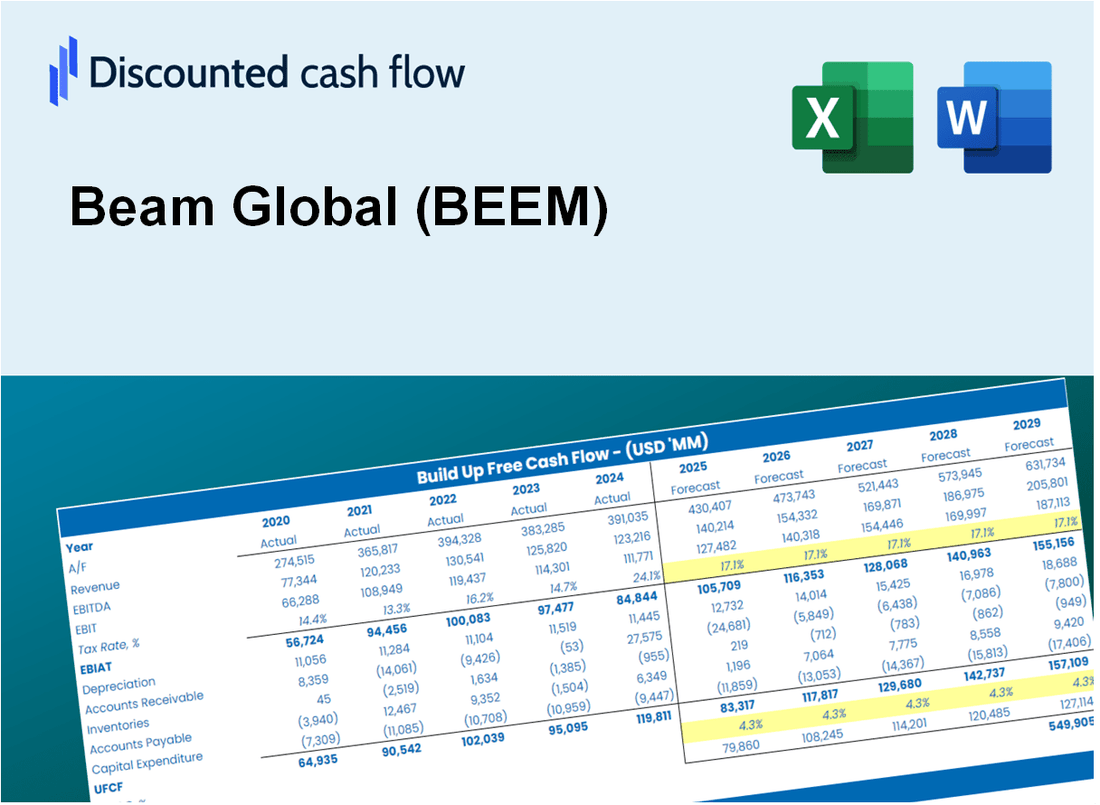
Discounted Cash Flow (DCF) - (USD MM)
| Year | AY1 2020 |
AY2 2021 |
AY3 2022 |
AY4 2023 |
AY5 2024 |
FY1 2025 |
FY2 2026 |
FY3 2027 |
FY4 2028 |
FY5 2029 |
|---|---|---|---|---|---|---|---|---|---|---|
| Revenue | 6.2 | 9.0 | 22.0 | 67.4 | 49.3 | 76.2 | 117.8 | 182.1 | 281.5 | 435.1 |
| Revenue Growth, % | 0 | 44.96 | 144.33 | 206.22 | -26.75 | 54.55 | 54.55 | 54.55 | 54.55 | 54.55 |
| EBITDA | -5.2 | -6.5 | -18.6 | -14.2 | -6.8 | -41.9 | -64.7 | -100.0 | -154.5 | -238.8 |
| EBITDA, % | -83.34 | -71.87 | -84.38 | -21.04 | -13.87 | -54.9 | -54.9 | -54.9 | -54.9 | -54.9 |
| Depreciation | .0 | .1 | 1.1 | 1.9 | 4.5 | 2.9 | 4.5 | 6.9 | 10.7 | 16.6 |
| Depreciation, % | 0.65945 | 1.39 | 5.09 | 2.76 | 9.12 | 3.8 | 3.8 | 3.8 | 3.8 | 3.8 |
| EBIT | -5.2 | -6.6 | -19.7 | -16.0 | -11.3 | -44.8 | -69.2 | -106.9 | -165.2 | -255.4 |
| EBIT, % | -84 | -73.26 | -89.47 | -23.81 | -22.99 | -58.7 | -58.7 | -58.7 | -58.7 | -58.7 |
| Total Cash | 26.7 | 21.9 | 1.7 | 10.4 | 4.6 | 35.4 | 54.8 | 84.6 | 130.8 | 202.2 |
| Total Cash, percent | .0 | .0 | .0 | .0 | .0 | .0 | .0 | .0 | .0 | .0 |
| Account Receivables | 1.8 | 3.9 | 4.4 | 16.1 | 8.0 | 20.1 | 31.1 | 48.1 | 74.3 | 114.9 |
| Account Receivables, % | 28.94 | 42.81 | 20.14 | 23.84 | 16.27 | 26.4 | 26.4 | 26.4 | 26.4 | 26.4 |
| Inventories | 1.1 | 1.6 | 12.2 | 11.9 | 12.3 | 20.4 | 31.5 | 48.7 | 75.3 | 116.4 |
| Inventories, % | 17.6 | 17.9 | 55.68 | 17.72 | 24.9 | 26.76 | 26.76 | 26.76 | 26.76 | 26.76 |
| Accounts Payable | .7 | 1.6 | 2.9 | 9.7 | 9.0 | 11.4 | 17.6 | 27.2 | 42.1 | 65.1 |
| Accounts Payable, % | 11.72 | 17.41 | 13.03 | 14.45 | 18.16 | 14.95 | 14.95 | 14.95 | 14.95 | 14.95 |
| Capital Expenditure | -.4 | -.6 | -1.0 | -1.1 | -.8 | -3.1 | -4.7 | -7.3 | -11.3 | -17.4 |
| Capital Expenditure, % | -5.78 | -6.47 | -4.55 | -1.57 | -1.68 | -4.01 | -4.01 | -4.01 | -4.01 | -4.01 |
| Tax Rate, % | 0.8263 | 0.8263 | 0.8263 | 0.8263 | 0.8263 | 0.8263 | 0.8263 | 0.8263 | 0.8263 | 0.8263 |
| EBITAT | -5.2 | -6.6 | -19.7 | -16.0 | -11.2 | -44.7 | -69.1 | -106.7 | -165.0 | -255.0 |
| Depreciation | ||||||||||
| Changes in Account Receivables | ||||||||||
| Changes in Inventories | ||||||||||
| Changes in Accounts Payable | ||||||||||
| Capital Expenditure | ||||||||||
| UFCF | -7.7 | -8.8 | -29.5 | -19.7 | -.7 | -62.6 | -85.2 | -131.7 | -203.5 | -314.5 |
| WACC, % | 10.4 | 10.4 | 10.4 | 10.4 | 10.4 | 10.4 | 10.4 | 10.4 | 10.4 | 10.4 |
| PV UFCF | ||||||||||
| SUM PV UFCF | -553.3 | |||||||||
| Long Term Growth Rate, % | 2.00 | |||||||||
| Free cash flow (T + 1) | -321 | |||||||||
| Terminal Value | -3,820 | |||||||||
| Present Terminal Value | -2,330 | |||||||||
| Enterprise Value | -2,883 | |||||||||
| Net Debt | -3 | |||||||||
| Equity Value | -2,880 | |||||||||
| Diluted Shares Outstanding, MM | 15 | |||||||||
| Equity Value Per Share | -196.99 |
What You Will Get
- Real BEEM Financials: Access to historical and projected data for precise valuation.
- Customizable Inputs: Adjust WACC, tax rates, revenue growth, and capital expenditures as needed.
- Dynamic Calculations: Intrinsic value and NPV are computed automatically.
- Scenario Analysis: Evaluate various scenarios to assess Beam Global’s potential performance.
- User-Friendly Design: Designed for professionals while remaining approachable for newcomers.
Key Features
- Innovative Energy Solutions: Offers cutting-edge renewable energy products for sustainable power generation.
- Comprehensive EV Charging Infrastructure: Provides a robust network of electric vehicle charging stations with user-friendly access.
- Customizable Energy Management: Tailor energy consumption and storage options to meet specific needs.
- Real-Time Monitoring Tools: Track energy usage and performance metrics through an intuitive dashboard.
- Data-Driven Insights: Leverage analytics to optimize energy efficiency and reduce operating costs.
How It Works
- Download the Template: Gain immediate access to the Excel-based BEAM DCF Calculator.
- Input Your Assumptions: Modify the yellow-highlighted cells for growth rates, WACC, margins, and other variables.
- Instant Calculations: The model automatically recalculates Beam Global’s intrinsic value.
- Test Scenarios: Experiment with various assumptions to assess potential changes in valuation.
- Analyze and Decide: Utilize the outcomes to inform your investment or financial analysis.
Why Choose This Calculator for Beam Global (BEEM)?
- All-in-One Solution: Offers DCF, WACC, and financial ratio analyses seamlessly integrated.
- Flexible Inputs: Modify yellow-highlighted cells to explore different financial scenarios.
- In-Depth Analysis: Automatically computes Beam Global’s intrinsic value and Net Present Value.
- Ready-to-Use Data: Historical and projected data provide reliable starting points for analysis.
- High-Quality Standards: Perfect for financial analysts, investors, and business advisors.
Who Should Use This Product?
- Individual Investors: Make informed decisions about buying or selling Beam Global (BEEM) stock.
- Financial Analysts: Streamline valuation processes with ready-to-use financial models for Beam Global (BEEM).
- Consultants: Deliver professional valuation insights on Beam Global (BEEM) to clients quickly and accurately.
- Business Owners: Understand how companies like Beam Global (BEEM) are valued to guide your own strategy.
- Finance Students: Learn valuation techniques using real-world data and scenarios related to Beam Global (BEEM).
What the Template Contains
- Pre-Filled DCF Model: Beam Global's financial data preloaded for immediate use.
- WACC Calculator: Detailed calculations for Weighted Average Cost of Capital.
- Financial Ratios: Evaluate Beam Global's profitability, leverage, and efficiency.
- Editable Inputs: Change assumptions such as growth, margins, and CAPEX to fit your scenarios.
- Financial Statements: Annual and quarterly reports to support detailed analysis.
- Interactive Dashboard: Easily visualize key valuation metrics and results.
Disclaimer
All information, articles, and product details provided on this website are for general informational and educational purposes only. We do not claim any ownership over, nor do we intend to infringe upon, any trademarks, copyrights, logos, brand names, or other intellectual property mentioned or depicted on this site. Such intellectual property remains the property of its respective owners, and any references here are made solely for identification or informational purposes, without implying any affiliation, endorsement, or partnership.
We make no representations or warranties, express or implied, regarding the accuracy, completeness, or suitability of any content or products presented. Nothing on this website should be construed as legal, tax, investment, financial, medical, or other professional advice. In addition, no part of this site—including articles or product references—constitutes a solicitation, recommendation, endorsement, advertisement, or offer to buy or sell any securities, franchises, or other financial instruments, particularly in jurisdictions where such activity would be unlawful.
All content is of a general nature and may not address the specific circumstances of any individual or entity. It is not a substitute for professional advice or services. Any actions you take based on the information provided here are strictly at your own risk. You accept full responsibility for any decisions or outcomes arising from your use of this website and agree to release us from any liability in connection with your use of, or reliance upon, the content or products found herein.