
|
Beazley Plc (Bez.L) DCF -Bewertung |
Fully Editable: Tailor To Your Needs In Excel Or Sheets
Professional Design: Trusted, Industry-Standard Templates
Investor-Approved Valuation Models
MAC/PC Compatible, Fully Unlocked
No Expertise Is Needed; Easy To Follow
Beazley plc (BEZ.L) Bundle
Vereinfachen Sie die Bewertung von Beazley Plc (Bezl) mit diesem anpassbaren DCF -Taschenrechner! Mit Real Beazley PLC (BEZL) -Fonds und einstellbaren Prognoseeingaben können Sie Szenarien testen und Beazley Plc (BEZL) in wenigen Minuten aufdecken.
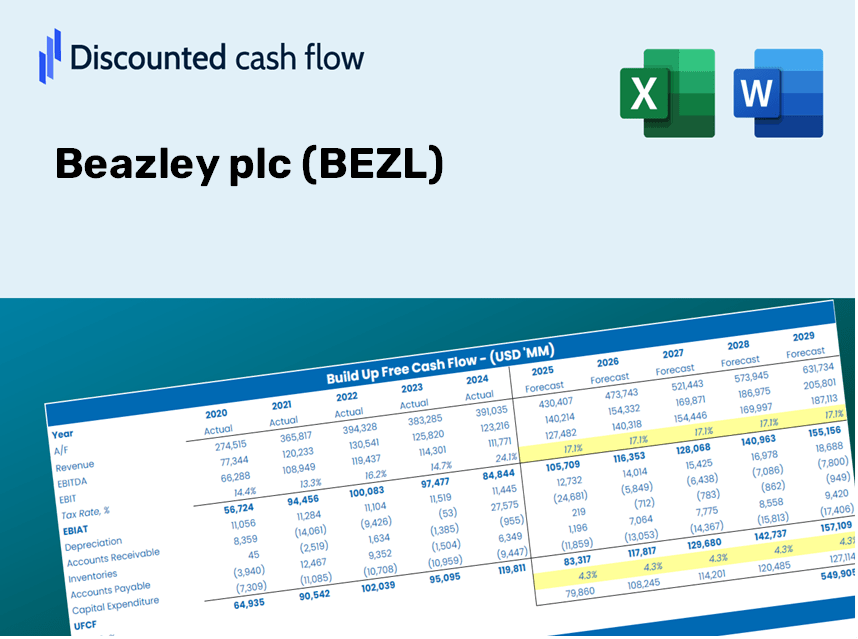
Discounted Cash Flow (DCF) - (USD MM)
| Year | AY1 2020 |
AY2 2021 |
AY3 2022 |
AY4 2023 |
AY5 2024 |
FY1 2025 |
FY2 2026 |
FY3 2027 |
FY4 2028 |
FY5 2029 |
|---|---|---|---|---|---|---|---|---|---|---|
| Revenue | 2,177.5 | 2,462.4 | 2,593.0 | 3,814.4 | 4,420.9 | 5,320.4 | 6,402.9 | 7,705.8 | 9,273.7 | 11,160.6 |
| Revenue Growth, % | 0 | 13.08 | 5.31 | 47.1 | 15.9 | 20.35 | 20.35 | 20.35 | 20.35 | 20.35 |
| EBITDA | .0 | 306.4 | 459.2 | -280.2 | 1,064.8 | 499.0 | 600.5 | 722.7 | 869.7 | 1,046.7 |
| EBITDA, % | 0 | 12.44 | 17.71 | -7.35 | 24.09 | 9.38 | 9.38 | 9.38 | 9.38 | 9.38 |
| Depreciation | 24.6 | 30.2 | 22.4 | -1,248.9 | .0 | -314.1 | -378.0 | -455.0 | -547.5 | -658.9 |
| Depreciation, % | 1.13 | 1.23 | 0.86252 | -32.74 | 0 | -5.9 | -5.9 | -5.9 | -5.9 | -5.9 |
| EBIT | -24.6 | 276.2 | 436.8 | 968.7 | 1,064.8 | 813.1 | 978.5 | 1,177.6 | 1,417.2 | 1,705.6 |
| EBIT, % | -1.13 | 11.22 | 16.85 | 25.39 | 24.09 | 15.28 | 15.28 | 15.28 | 15.28 | 15.28 |
| Total Cash | 231.5 | 442.7 | 488.1 | 443.8 | 659.8 | 787.3 | 947.5 | 1,140.3 | 1,372.3 | 1,651.6 |
| Total Cash, percent | .0 | .0 | .0 | .0 | .0 | .0 | .0 | .0 | .0 | .0 |
| Account Receivables | .0 | .0 | .0 | .0 | 447.5 | 107.7 | 129.6 | 156.0 | 187.7 | 225.9 |
| Account Receivables, % | 0 | 0 | 0 | 0 | 10.12 | 2.02 | 2.02 | 2.02 | 2.02 | 2.02 |
| Inventories | .0 | .0 | .0 | .0 | .0 | .0 | .0 | .0 | .0 | .0 |
| Inventories, % | 0 | 0 | 0 | 0 | 0 | 0 | 0 | 0 | 0 | 0 |
| Accounts Payable | 294.6 | 381.9 | 374.8 | .0 | .0 | 462.8 | 557.0 | 670.3 | 806.7 | 970.8 |
| Accounts Payable, % | 13.53 | 15.51 | 14.46 | 0 | 0 | 8.7 | 8.7 | 8.7 | 8.7 | 8.7 |
| Capital Expenditure | -9.6 | -3.4 | -.7 | -41.3 | -47.0 | -29.3 | -35.3 | -42.4 | -51.1 | -61.5 |
| Capital Expenditure, % | -0.44313 | -0.1367 | -0.02884671 | -1.08 | -1.06 | -0.55074 | -0.55074 | -0.55074 | -0.55074 | -0.55074 |
| Tax Rate, % | 20.6 | 20.6 | 20.6 | 20.6 | 20.6 | 20.6 | 20.6 | 20.6 | 20.6 | 20.6 |
| EBITAT | -22.5 | 230.9 | 361.5 | 792.9 | 845.5 | 681.5 | 820.2 | 987.1 | 1,187.9 | 1,429.6 |
| Depreciation | ||||||||||
| Changes in Account Receivables | ||||||||||
| Changes in Inventories | ||||||||||
| Changes in Accounts Payable | ||||||||||
| Capital Expenditure | ||||||||||
| UFCF | 287.1 | 345.0 | 376.1 | -872.1 | 351.0 | 1,140.7 | 479.1 | 576.6 | 694.0 | 835.2 |
| WACC, % | 5.58 | 5.55 | 5.55 | 5.54 | 5.53 | 5.55 | 5.55 | 5.55 | 5.55 | 5.55 |
| PV UFCF | ||||||||||
| SUM PV UFCF | 3,197.7 | |||||||||
| Long Term Growth Rate, % | 2.00 | |||||||||
| Free cash flow (T + 1) | 852 | |||||||||
| Terminal Value | 23,994 | |||||||||
| Present Terminal Value | 18,315 | |||||||||
| Enterprise Value | 21,512 | |||||||||
| Net Debt | -199 | |||||||||
| Equity Value | 21,712 | |||||||||
| Diluted Shares Outstanding, MM | 674 | |||||||||
| Equity Value Per Share | 3,221.78 |
What You'll Receive
- Authentic BEZL Financials: Access to both historical and projected data for precise valuation.
- Customizable Inputs: Adjust WACC, tax rates, revenue growth, and capital spending as needed.
- Automated Calculations: Intrinsic value and NPV are computed in real-time.
- Scenario Analysis: Explore various scenarios to assess Beazley plc's future prospects.
- User-Friendly Design: Designed for professionals while remaining easy to navigate for newcomers.
Key Features
- Pre-Loaded Data: Beazley plc’s historical financial statements and pre-filled forecasts.
- Fully Adjustable Inputs: Customize WACC, tax rates, revenue growth, and EBITDA margins.
- Instant Results: View Beazley plc’s intrinsic value recalculating in real time.
- Clear Visual Outputs: Dashboard charts present valuation results and key metrics.
- Built for Accuracy: A professional tool designed for analysts, investors, and finance professionals.
How It Operates
- Step 1: Download the Excel file.
- Step 2: Examine the pre-filled Beazley plc (BEZL) data (historical and forecasted).
- Step 3: Modify key assumptions (yellow cells) based on your evaluation.
- Step 4: Observe automatic recalculations for Beazley plc's (BEZL) intrinsic value.
- Step 5: Utilize the results for investment decisions or reporting purposes.
Why Opt for This Calculator?
- All-in-One Solution: Features DCF, WACC, and financial ratio analyses seamlessly integrated.
- Flexible Inputs: Modify the yellow-highlighted fields to explore various scenarios.
- In-Depth Analysis: Automatically calculates Beazley plc’s intrinsic value and Net Present Value.
- Data Ready: Access to historical and projected data provides reliable starting figures.
- High-Quality Standards: Perfect for financial analysts, investors, and business advisors.
Who Can Benefit from This Product?
- Investors: Evaluate Beazley plc’s (BEZL) valuation to make informed buy or sell decisions.
- CFOs and Financial Analysts: Optimize valuation workflows and validate financial projections.
- Startup Founders: Discover how established public companies like Beazley plc are appraised.
- Consultants: Provide detailed valuation reports to your clients effectively.
- Students and Educators: Utilize real-time data to enhance learning and practice in valuation methodologies.
Contents of the Template
- Operating and Balance Sheet Data: Pre-filled historical data and forecasts for Beazley plc (BEZL), including metrics such as revenue, EBITDA, EBIT, and capital expenditures.
- WACC Calculation: A dedicated sheet for calculating the Weighted Average Cost of Capital (WACC), featuring inputs like Beta, risk-free rate, and share price.
- DCF Valuation (Unlevered and Levered): Customizable Discounted Cash Flow models that provide intrinsic value along with detailed calculations.
- Financial Statements: Pre-loaded annual and quarterly financial statements for Beazley plc (BEZL) to facilitate analysis.
- Key Ratios: Includes important profitability, leverage, and efficiency ratios specific to Beazley plc (BEZL).
- Dashboard and Charts: A visual overview of valuation results and underlying assumptions for easy analysis of outputs.
Disclaimer
All information, articles, and product details provided on this website are for general informational and educational purposes only. We do not claim any ownership over, nor do we intend to infringe upon, any trademarks, copyrights, logos, brand names, or other intellectual property mentioned or depicted on this site. Such intellectual property remains the property of its respective owners, and any references here are made solely for identification or informational purposes, without implying any affiliation, endorsement, or partnership.
We make no representations or warranties, express or implied, regarding the accuracy, completeness, or suitability of any content or products presented. Nothing on this website should be construed as legal, tax, investment, financial, medical, or other professional advice. In addition, no part of this site—including articles or product references—constitutes a solicitation, recommendation, endorsement, advertisement, or offer to buy or sell any securities, franchises, or other financial instruments, particularly in jurisdictions where such activity would be unlawful.
All content is of a general nature and may not address the specific circumstances of any individual or entity. It is not a substitute for professional advice or services. Any actions you take based on the information provided here are strictly at your own risk. You accept full responsibility for any decisions or outcomes arising from your use of this website and agree to release us from any liability in connection with your use of, or reliance upon, the content or products found herein.