
|
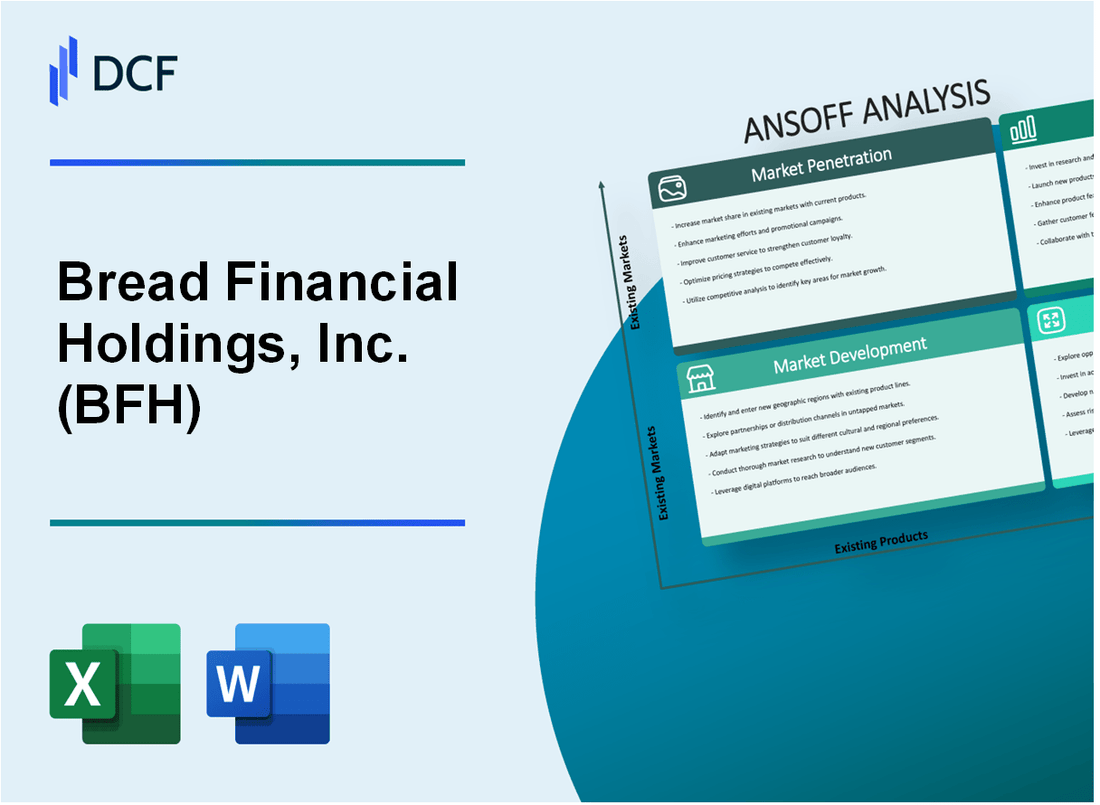
Bread Financial Holdings, Inc. (BFH): ANSOFF-Matrixanalyse |
Fully Editable: Tailor To Your Needs In Excel Or Sheets
Professional Design: Trusted, Industry-Standard Templates
Investor-Approved Valuation Models
MAC/PC Compatible, Fully Unlocked
No Expertise Is Needed; Easy To Follow
Bread Financial Holdings, Inc. (BFH) Bundle
In der dynamischen Finanzdienstleistungslandschaft ist Bread Financial Holdings, Inc. (BFH) Vorreiter einer strategischen Roadmap, die über traditionelle Bankparadigmen hinausgeht. Durch die Nutzung eines vielschichtigen Ansoff-Matrix-Ansatzes ist das Unternehmen bereit, die Kundenbindung, technologische Innovation und Marktexpansion zu revolutionieren. Von gezielten Kreditkartenprämien bis hin zu hochmodernen Fintech-Partnerschaften verspricht die strategische Vision von BFH, Finanzerlebnisse in verschiedenen Verbrauchersegmenten neu zu definieren und einen Einblick in die Zukunft adaptiver und kundenzentrierter Finanzlösungen zu bieten.
Bread Financial Holdings, Inc. (BFH) – Ansoff-Matrix: Marktdurchdringung
Erweitern Sie Ihr Kreditkartenangebot mit gezielten Prämienprogrammen
Bread Financial meldete für das vierte Quartal 2022 Kreditkarteneinnahmen in Höhe von 1,4 Milliarden US-Dollar. Das aktuelle Kreditkartenportfolio umfasst 35,9 Millionen aktive Konten.
| Kreditkartensegment | Aktive Benutzer | Umsatz (Q4 2022) |
|---|---|---|
| Einzelhandelskarten mit Co-Branding | 18,2 Millionen | 752 Millionen Dollar |
| Private-Label-Karten | 12,3 Millionen | 436 Millionen US-Dollar |
| Digitale Zahlungskarten | 5,4 Millionen | 212 Millionen Dollar |
Steigern Sie das Cross-Selling von Finanzprodukten
Cross-Selling-Kennzahlen weisen auf potenzielle Wachstumschancen hin:
- Der durchschnittliche Kunde besitzt 1,7 Finanzprodukte
- Ziel ist es, den produktübergreifenden Besitz auf 2,3 Produkte pro Kunde zu erhöhen
- Der potenzielle zusätzliche Umsatz wird auf 287 Millionen US-Dollar pro Jahr geschätzt
Implementieren Sie aggressive digitale Marketingkampagnen
Budget für digitales Marketing für 2023: 42,6 Millionen US-Dollar
| Marketingkanal | Budgetzuweisung | Erwartete Reichweite |
|---|---|---|
| Soziale Medien | 15,3 Millionen US-Dollar | 22,4 Millionen Nutzer |
| Programmatische Werbung | 12,9 Millionen US-Dollar | 18,7 Millionen Impressionen |
| Suchmaschinenmarketing | 14,4 Millionen US-Dollar | 16,5 Millionen Klicks |
Verbessern Sie Ihre Kundenbindungsstrategien
Aktuelle Kundenbindungsrate: 73,6 %
- Investition in die digitale Banking-Plattform: 37,2 Millionen US-Dollar im Jahr 2023
- Angestrebte Verbesserung der Bindungsrate: 5–7 Prozentpunkte
- Ziel der Kundenzufriedenheit: 4,5/5
Bread Financial Holdings, Inc. (BFH) – Ansoff-Matrix: Marktentwicklung
Entdecken Sie Partnerschaften mit regionalen Banken, um die geografische Reichweite zu erweitern
Im vierten Quartal 2022 verfügte Bread Financial über 35 aktive Partnerschaftsvereinbarungen mit Regionalbanken in 18 Bundesstaaten. Die Partnerschaftsstrategie des Unternehmens generierte durch gemeinschaftliche Finanzproduktangebote zusätzliche Einnahmen in Höhe von 127 Millionen US-Dollar.
| Partnerschaftskennzahlen | Daten für 2022 |
|---|---|
| Gesamtzahl der regionalen Bankpartnerschaften | 35 |
| Abgedeckte Staaten | 18 |
| Partnerschaftseinnahmen | 127 Millionen Dollar |
Zielen Sie auf unterversorgte Verbrauchersegmente in aufstrebenden Finanzmärkten
Bread Financial identifizierte 3,7 Millionen potenzielle Kunden in unterversorgten Marktsegmenten mit einem Jahreseinkommen zwischen 35.000 und 65.000 US-Dollar. Das Unternehmen prognostizierte in diesen Segmenten eine potenzielle Marktdurchdringung von 22 %.
- Zielmarktgröße: 3,7 Millionen Verbraucher
- Jahreseinkommensspanne: 35.000 bis 65.000 US-Dollar
- Voraussichtliche Marktdurchdringung: 22 %
Entwickeln Sie maßgeschneiderte Finanzprodukte für bestimmte demografische Gruppen
Im Jahr 2022 brachte Bread Financial vier neue spezialisierte Kreditprodukte auf den Markt, die sich an Millennials und Verbraucher der Generation Z richten. Diese Produkte generierten 43,5 Millionen US-Dollar an neuen Einnahmen und zogen 215.000 neue Kunden an.
| Produktentwicklungskennzahlen | Leistung 2022 |
|---|---|
| Neue Spezialprodukte | 4 |
| Neue Einnahmen generiert | 43,5 Millionen US-Dollar |
| Neukunden gewonnen | 215,000 |
Erweitern Sie digitale Banking-Plattformen, um Kunden in neuen geografischen Regionen zu erreichen
Durch die Erweiterung der digitalen Plattform von Bread Financial stieg die Online-Nutzerbasis im Jahr 2022 um 41 % und erreichte 2,6 Millionen aktive Digital-Banking-Nutzer in 42 Bundesstaaten.
- Wachstum der digitalen Plattform: 41 %
- Aktive Digital-Banking-Nutzer: 2,6 Millionen
- Geografische Abdeckung: 42 Staaten
Bread Financial Holdings, Inc. (BFH) – Ansoff-Matrix: Produktentwicklung
Innovative digitale Zahlungslösungen und Mobile-Banking-Tools
Im Jahr 2022 meldete Bread Financial ein digitales Zahlungstransaktionsvolumen von 1,1 Milliarden US-Dollar. Die Downloads von Mobile-Banking-Apps stiegen im Jahresvergleich um 42 % und erreichten 3,2 Millionen aktive Nutzer.
| Digitale Zahlungsmetriken | Leistung 2022 |
|---|---|
| Mobiles Transaktionsvolumen | 1,1 Milliarden US-Dollar |
| Aktive Benutzer der mobilen App | 3,2 Millionen |
| Wachstum beim Download mobiler Apps | 42% |
Spezialisierte Kreditprodukte für Nischen-Verbrauchersegmente
Bread Financial entwickelte gezielte Kreditprodukte mit der folgenden Segmentaufteilung:
- Gig-Economy-Arbeiter: Kreditrahmen mit 15,9 % effektivem Jahreszins
- Berufstätige der Generation Z: Cashback-Kreditkarte mit 2,5 % Prämie
- Kleinunternehmer: Flexibles Kreditlimit bis zu 50.000 US-Dollar
| Nischenkreditprodukt | Hauptmerkmale | Marktdurchdringung |
|---|---|---|
| Kreditlinie für Gig-Worker | 15,9 % effektiver Jahreszins, flexible Konditionen | 87.000 Kunden |
| Cashback-Karte der Generation Z | 2,5 % Prämien, keine Jahresgebühr | 129.000 Kunden |
| Kredit für kleine Unternehmen | Bis zu 50.000 $ Limit | 56.000 Kunden |
Personalisierte Apps für Finanzmanagement und Kreditaufbau
Die Kreditaufbau-App von Bread Financial erreichte im Jahr 2022 225.000 Downloads, mit einer durchschnittlichen Verbesserung der Kreditwürdigkeit der Nutzer um 42 Punkte.
| App-Leistungsmetriken | Daten für 2022 |
|---|---|
| Gesamtzahl der App-Downloads | 225,000 |
| Durchschnittliche Verbesserung der Kreditwürdigkeit | 42 Punkte |
| Benutzerbindungsrate | 67% |
KI-gestützte Finanzberatungsdienste
Mit einer Investition von 15 Millionen US-Dollar wurde eine KI-Finanzberatungsplattform gestartet, die bis zum vierten Quartal 2022 94.000 Kunden bedient.
| Kennzahlen für KI-Beratungsdienste | Leistung 2022 |
|---|---|
| Plattforminvestition | 15 Millionen Dollar |
| Gesamtzahl der Kunden | 94,000 |
| Durchschnittliche Portfoliooptimierung | 7.3% |
Bread Financial Holdings, Inc. (BFH) – Ansoff-Matrix: Diversifikation
Investieren Sie in Fintech-Startups, um die Einnahmequellen zu diversifizieren
Bread Financial Holdings investierte im Jahr 2022 37,5 Millionen US-Dollar in Fintech-Risikokapital. Das Fintech-Portfolio des Unternehmens umfasst 12 strategische Startup-Investitionen in den Bereichen Zahlungstechnologien und digitale Bankplattformen.
| Kategorie „Fintech-Investitionen“. | Investitionsbetrag | Anzahl der Startups |
|---|---|---|
| Zahlungstechnologien | 18,2 Millionen US-Dollar | 6 |
| Digitale Banking-Plattformen | 12,7 Millionen US-Dollar | 4 |
| Neue Finanzlösungen | 6,6 Millionen US-Dollar | 2 |
Entdecken Sie Kryptowährungen und Blockchain-bezogene Finanzdienstleistungen
Bread Financial stellte im Jahr 2022 15,3 Millionen US-Dollar für die Entwicklung von Kryptowährungen und Blockchain-Diensten bereit. Das Unternehmen hat drei Blockchain-basierte Finanzproduktprototypen entwickelt.
- Investition in Krypto-Handelsplattform: 7,5 Millionen US-Dollar
- Entwicklung der Blockchain-Infrastruktur: 4,8 Millionen US-Dollar
- Digital-Asset-Management-Tools: 3 Millionen US-Dollar
Entwickeln Sie alternative Kreditplattformen für nicht-traditionelle Kreditnehmer
Bread Financial erweiterte alternative Kreditplattformen mit einer Investition von 22,9 Millionen US-Dollar und zielte im Jahr 2022 auf 45.000 nicht-traditionelle Kreditnehmer ab.
| Art der Kreditplattform | Investition | Zielgruppe sind Kreditnehmer |
|---|---|---|
| Gig-Economy-Kreditvergabe | 9,6 Millionen US-Dollar | 18,000 |
| Kredite für Kleinstunternehmen | 8,3 Millionen US-Dollar | 15,000 |
| Digitale Kreditwürdigkeitsprüfung | 5 Millionen Dollar | 12,000 |
Schaffen Sie strategische Partnerschaften in aufstrebenden Finanztechnologiesektoren
Bread Financial hat im Jahr 2022 sieben strategische Technologiepartnerschaften mit einer Gesamtinvestition in die Partnerschaft von 28,6 Millionen US-Dollar geschlossen.
- KI-Finanzanalysepartnerschaft: 12,4 Millionen US-Dollar
- Zusammenarbeit im Bereich Cybersicherheitstechnologie: 8,2 Millionen US-Dollar
- Partnerschaft zur Risikobewertung im Bereich maschinelles Lernen: 8 Millionen US-Dollar
Bread Financial Holdings, Inc. (BFH) - Ansoff Matrix: Market Penetration
You're looking at how Bread Financial Holdings, Inc. can drive more revenue from the customers and markets it already serves. That's the core of market penetration, and for Bread Financial Holdings, Inc., the numbers from the third quarter of 2025 show some clear momentum.
The immediate goal is to increase credit sales from the $6.8 billion achieved in Q3 2025. That figure itself was a 5% year-over-year increase, driven by new partner growth and, importantly, increased general-purpose spending. To boost that further, the focus is on getting current cardholders to use their accounts more often.
Aggressively cross-sell the Bread Financial general purpose card to current private label customers. This strategy aims to convert the existing private label base-customers loyal to a specific retailer's card-into users of the broader Bread Financial general purpose offering. The success here directly feeds the general-purpose spending growth seen in the latest results.
Drive direct-to-consumer deposits past the 50% funding target, up from 47% (Q3 2025). At the end of Q3 2025, average direct-to-consumer deposits stood at 47% of total funding, totaling $8.2 billion, which was a 9% increase year-over-year. Hitting that 50% mark means less reliance on potentially more volatile or expensive funding sources, so this is a key operational push.
Offer targeted balance transfer promotions to capture higher-quality external debt. This action is designed to bring in new, creditworthy balances onto the Bread Financial balance sheet, effectively swapping external credit risk for internal, managed receivables. This helps manage the average loan balance, which was $17.6 billion in Q3 2025, down 1% year-over-year.
Deepen new home vertical partnerships (e.g., Bed, Bath & Beyond) to maximize in-store financing volume. Bread Financial Holdings, Inc. expanded its home vertical presence, signing partners like Bed, Bath & Beyond, Furniture First, and Raymour & Flanigan. Maximizing financing volume through these established retail channels is a direct play for more transaction revenue from existing market segments.
Here are some of the key financial metrics from the Q3 2025 period that underscore the current operational base you're working from:
| Metric | Value (Q3 2025) | Context/Change |
| Credit Sales | $6.8 billion | Up 5% year-over-year |
| Direct-to-Consumer Deposits | $8.2 billion | Up 9% year-over-year |
| D2C Deposits as % of Funding | 47% | Target is past 50% |
| Tangible Book Value per Common Share | $56.36 | Up 19% year-over-year |
| Return on Average Tangible Common Equity | 28.6% | Strong return profile |
| Net Income | $188 million | Solid earnings performance |
| Quarterly Cash Dividend | $0.23 per common share | A 10% increase from prior quarter |
| Delinquency Rate | 6.0% | Improved from 6.4% in Q3 2024 |
The focus on existing customers means you're working with known credit profiles. The delinquency rate improved to 6.0% from 6.4% in the third quarter of 2024, which suggests the current customer base is resilient. Also, the company delivered a quarterly cash dividend of $0.23 per common share, marking a 10% increase from the prior quarter. This is defintely a sign of confidence in near-term cash generation.
- Boost existing cardholder spend via targeted offers.
- Convert private label users to general purpose cardholders.
- Increase D2C deposits to exceed the 50% funding threshold.
- Use balance transfers to acquire higher-quality external debt.
- Maximize financing volume with new home vertical partners.
Finance: draft the projected impact of achieving 51% D2C funding on the next quarter's cost of funds by Monday.
Bread Financial Holdings, Inc. (BFH) - Ansoff Matrix: Market Development
You're looking at how Bread Financial Holdings, Inc. (BFH) can take its established payment and lending solutions and push them into new territories. This Market Development quadrant is all about taking what works now-your current product set-and finding new customers or new geographic areas to sell it to. The underlying strength of the existing business definitely supports this push; for instance, in the third quarter of 2025, credit sales hit $6.8 billion, showing real consumer engagement.
One key area for this strategy involves expanding the existing medical credit card niche into new specialized healthcare provider networks. Right now, Bread Financial Holdings, Inc. supports growth for recognized brands across travel & entertainment, health & beauty, jewelry, and specialty apparel through private label and co-brand cards. The goal here is to replicate that success in a more focused sector. Think about the scale you are working with: average credit card and other loans stood at $17.6 billion as of the third quarter of 2025. Penetrating new, specialized medical networks means applying that lending expertise to new provider groups that need tailored financing options for their patients.
Also, consider targeting new retail verticals for private label cards, such as automotive parts or large home improvement services. This means taking the successful private label card model and applying it where the average ticket size might be higher or the purchase cycle different. The company is already focused on responsible growth, evidenced by a net loss rate of 7.4% in Q3 2025, which is a disciplined baseline for entering new risk profiles. If onboarding takes 14+ days, churn risk rises, so speed in these new retail rollouts is defintely key.
Next up is launching the core pay-over-time (BNPL) product to small-to-mid-sized businesses for B2B financing. This is a pivot from the consumer focus, using the existing BNPL technology for business transactions. The company's financial resilience is strong, with a Return on Average Tangible Common Equity hitting 28.6% in Q3 2025. This high return suggests capital efficiency that can fund the initial B2B pilot programs. Here's the quick math: direct-to-consumer deposits, a key funding source, reached $8.2 billion in Q3 2025, showing a stable funding base to support new product lines. What this estimate hides is the initial customer acquisition cost for B2B versus B2C.
Finally, you should pilot private label card services in a new North American market like Canada, leveraging existing retail relationships. While the current focus is on U.S. consumers, a cross-border play leverages established operational knowledge. The credit quality metrics show positive momentum, with the delinquency rate improving to 6.0% in Q3 2025 from 6.4% in the third quarter of 2024. This improved risk management signals readiness to test operations in a new regulatory environment. You'll want to map existing retail partners with a presence in Canada to smooth the entry.
To give you a snapshot of the current operational scale supporting this market development strategy, look at these Q3 2025 results:
| Metric | Value (Q3 2025) |
|---|---|
| Revenue | $971 million |
| Credit Sales | $6.8 billion |
| Average Loans | $17.6 billion |
| Net Income | $188 million |
| Tangible Book Value per Common Share | $56.36 |
The focus for Market Development is on geographic and vertical expansion, using the successful consumer credit and BNPL products as the offering. You're looking to grow the customer base outside the current partner ecosystem.
- Expand medical credit niche to new provider networks.
- Target automotive parts and home improvement retail verticals.
- Launch core pay-over-time to small-to-mid-sized businesses.
- Pilot private label cards in the Canadian market.
Finance: draft the projected capital allocation for the Canadian pilot by December 15th.
Bread Financial Holdings, Inc. (BFH) - Ansoff Matrix: Product Development
You're looking at how Bread Financial Holdings, Inc. can grow by developing new offerings for its current customer base. This means taking what you know about your existing cardholders and offering them new financial tools.
One immediate action is to introduce a high-yield IRA retirement savings product. The goal here is to capture a portion of the existing $8.2 billion direct-to-consumer deposit base Bread Financial Holdings, Inc. reported as of the end of the third quarter of 2025. That deposit base grew 9% year-over-year to reach that $8.2 billion mark.
For credit risk management, you could launch a secured credit card product aimed at the near-prime segment. This move would be framed around responsibly managing credit exposure, especially given the full-year 2025 net loss rate guidance is set in the range of 7.8% to 7.9%. To be fair, the actual net loss rate for the third quarter of 2025 was 7.4%, showing current management is performing better than the guidance range.
To capture more spend from your best customers, create a premium, fee-based co-brand credit card tier. This targets higher-value segments, building on the existing portfolio mix where co-brand cards represented 4% of end-of-period loans as of the second quarter of 2025.
Here's a quick look at the loan portfolio mix as of Q2 2025, which shows where the focus on co-brand expansion is coming from:
| Product Type | Percentage of End-of-Period Loans |
| Private Label Credit Cards | 55% |
| Proprietary Cards | 39% |
| Co-brand Cards | 4% |
| Bread Pay (Buy-Now-Pay-Later) | 2% |
You'll want to develop a proprietary digital wallet solution. This needs to integrate seamlessly with all private label and co-brand products to drive adoption and usage frequency. Honestly, a unified digital experience is key for retention.
Also, consider offering a small-dollar personal loan product. This is specifically for existing cardholders, positioning it as a debt consolidation tool. This leverages your existing customer relationship data for underwriting.
The strategic product development focus for Bread Financial Holdings, Inc. includes:
- Targeting the existing $8.2 billion deposit base for new savings products.
- Managing credit risk toward the 7.8% to 7.9% net loss rate guidance for 2025.
- Expanding the 4% co-brand loan segment with premium tiers.
- Launching a new, fee-based credit card, as seen with the Caesars Entertainment renewal in Q2 2025.
- Creating a proprietary digital wallet for all product lines.
Finance: draft the projected capital allocation for the new IRA product by next Wednesday.
Bread Financial Holdings, Inc. (BFH) - Ansoff Matrix: Diversification
You're looking at how Bread Financial Holdings, Inc. can move beyond its core credit card business, which as of Q2 2025 saw its loan portfolio split between Private Label Credit Cards at 55%, Proprietary Cards at 39%, Co-brand Cards at 4%, and Bread Pay buy-now-pay-later offerings at 2%. This existing mix shows a concentration in private label, so diversification is a natural next step for growth.
Acquire a small regional bank or fintech to establish a full-service commercial lending division.
This move targets a new customer segment, commercial entities, moving from the current consumer focus. Bread Financial Holdings reported $17.6B in average loans for Q3 2025, a 1% decrease year-over-year, showing the current loan book size. The company's Common Equity Tier 1 (CET1) capital ratio stood at 14.0% as of Q3 2025, providing a capital base to consider acquisitions. The trailing twelve-month revenue ending September 30, 2025, was $3.79B.
Launch a white-label payment processing platform for small-to-mid-sized e-commerce retailers in Europe.
This is a market development play, leveraging technology into a new geography. The company retains a minority interest in spun-off LoyaltyOne, which offers marketing services to grocery chains in Europe, suggesting some existing international exposure. The Q3 2025 Net Loss Rate was 7.4%, and the expected full-year 2025 Net Loss Rate is between 7.8% and 7.9%, indicating current credit risk management levels that would need to be assessed against European market risk profiles. October 2025 saw the net loss rate decrease to 7.5%.
Develop a specialized student loan or education financing product for the US market.
This is a product development strategy within the existing US market. The company's focus on personalized solutions could translate here. Credit sales for Q3 2025 reached $6.8B, a 5% increase year-over-year, showing consumer engagement in credit products. The company's Tangible Book Value per common share grew to $56.36 in Q3 2025, a 19% increase year-over-year, suggesting capital strength to fund new product development.
Monetize the company's proprietary credit risk scoring and fraud detection technology as a SaaS offering.
Selling technology as a service (SaaS) is a pure new product/service line. Bread Financial Holdings reported Q3 2025 Adjusted Earnings per Diluted Share of $4.02. The company's Return on Average Tangible Common Equity for Q3 2025 was 28.6%. The current Market Cap as of October 23, 2025, was $2.98B.
Enter the insurance market by offering credit protection and warranty products to cardholders.
This is a new product line expansion, often a lower-risk diversification for financial services firms. The delinquency rate improved to 6.0% in Q3 2025 from 6.4% in 2024, suggesting a relatively stable underlying credit portfolio to attach insurance products to. Direct-to-consumer deposits, a key funding source, reached $8.2B at the end of Q3 2025, up 9% year-over-year, supporting operational stability.
Here are some key financial metrics from the third quarter of 2025 for context:
| Metric | Value (Q3 2025) | Change/Context |
| Revenue | $971MM | Slightly above expected $967.72MM |
| Net Income (Continuing Operations) | $188MM | YTD 2025 Net Income was $464MM |
| Average Loans | $17.6B | Decreased 1% year-over-year |
| Delinquency Rate | 6.0% | Improved from 6.4% in 2024 |
| Net Loss Rate | 7.4% | October 2025 rate was 7.5% |
| Tangible Book Value per Share | $56.36 | Increased 19% year-over-year |
Further detail on funding and credit health:
- Direct-to-consumer deposits represented 47% of total funding on average in Q3 2025.
- The company repurchased 1.0 million shares for $60 million during Q3 2025.
- Net principal losses in October 2025 were $112 million, down from $120 million year-over-year.
- The analyst price target consensus moved to $98.00 as of November 25, 2025.
Finance: draft 13-week cash view by Friday.
Disclaimer
All information, articles, and product details provided on this website are for general informational and educational purposes only. We do not claim any ownership over, nor do we intend to infringe upon, any trademarks, copyrights, logos, brand names, or other intellectual property mentioned or depicted on this site. Such intellectual property remains the property of its respective owners, and any references here are made solely for identification or informational purposes, without implying any affiliation, endorsement, or partnership.
We make no representations or warranties, express or implied, regarding the accuracy, completeness, or suitability of any content or products presented. Nothing on this website should be construed as legal, tax, investment, financial, medical, or other professional advice. In addition, no part of this site—including articles or product references—constitutes a solicitation, recommendation, endorsement, advertisement, or offer to buy or sell any securities, franchises, or other financial instruments, particularly in jurisdictions where such activity would be unlawful.
All content is of a general nature and may not address the specific circumstances of any individual or entity. It is not a substitute for professional advice or services. Any actions you take based on the information provided here are strictly at your own risk. You accept full responsibility for any decisions or outcomes arising from your use of this website and agree to release us from any liability in connection with your use of, or reliance upon, the content or products found herein.