
|
Beimene, Ltd. (BGNE) DCF -Bewertung |
Fully Editable: Tailor To Your Needs In Excel Or Sheets
Professional Design: Trusted, Industry-Standard Templates
Investor-Approved Valuation Models
MAC/PC Compatible, Fully Unlocked
No Expertise Is Needed; Easy To Follow
BeiGene, Ltd. (BGNE) Bundle
Vereinfachen Sie Beimene, Ltd. (BGNE) Bewertung mit diesem anpassbaren DCF -Taschenrechner! Mit Real Beimene, Ltd. (BGNE) Finanzdaten und einstellbaren Prognoseeingängen können Sie Szenarien testen und beige, Ltd. (BGNE) in Minuten aufdecken.
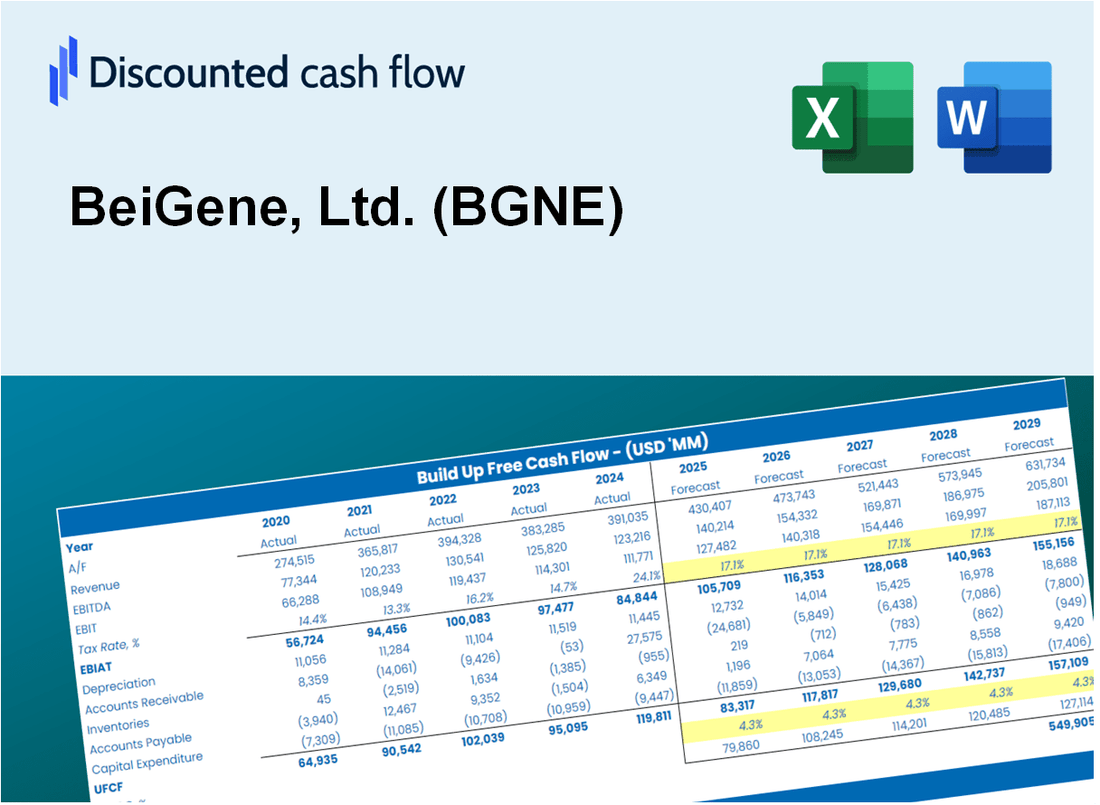
Discounted Cash Flow (DCF) - (USD MM)
| Year | AY1 2019 |
AY2 2020 |
AY3 2021 |
AY4 2022 |
AY5 2023 |
FY1 2024 |
FY2 2025 |
FY3 2026 |
FY4 2027 |
FY5 2028 |
|---|---|---|---|---|---|---|---|---|---|---|
| Revenue | 428.2 | 308.9 | 1,176.3 | 1,415.9 | 2,458.8 | 3,480.1 | 4,925.7 | 6,971.8 | 9,867.9 | 13,966.9 |
| Revenue Growth, % | 0 | -27.87 | 280.83 | 20.37 | 73.65 | 41.54 | 41.54 | 41.54 | 41.54 | 41.54 |
| EBITDA | -941.3 | -1,625.9 | -1,393.2 | -1,727.4 | -1,124.6 | -3,102.5 | -4,391.2 | -6,215.2 | -8,797.0 | -12,451.2 |
| EBITDA, % | -219.81 | -526.39 | -118.44 | -122 | -45.74 | -89.15 | -89.15 | -89.15 | -89.15 | -89.15 |
| Depreciation | 18.6 | 31.8 | 46.5 | 66.3 | 87.7 | 186.8 | 264.4 | 374.2 | 529.6 | 749.6 |
| Depreciation, % | 4.35 | 10.29 | 3.95 | 4.68 | 3.57 | 5.37 | 5.37 | 5.37 | 5.37 | 5.37 |
| EBIT | -959.9 | -1,657.7 | -1,439.7 | -1,793.7 | -1,212.3 | -3,127.3 | -4,426.3 | -6,265.0 | -8,867.4 | -12,550.8 |
| EBIT, % | -224.16 | -536.69 | -122.39 | -126.68 | -49.3 | -89.86 | -89.86 | -89.86 | -89.86 | -89.86 |
| Total Cash | 985.5 | 4,658.7 | 6,624.8 | 4,540.3 | 3,174.4 | 3,480.1 | 4,925.7 | 6,971.8 | 9,867.9 | 13,966.9 |
| Total Cash, percent | .0 | .0 | .0 | .0 | .0 | .0 | .0 | .0 | .0 | .0 |
| Account Receivables | 70.9 | 79.7 | 500.2 | 173.2 | 395.9 | 787.9 | 1,115.2 | 1,578.4 | 2,234.1 | 3,162.1 |
| Account Receivables, % | 16.55 | 25.79 | 42.52 | 12.23 | 16.1 | 22.64 | 22.64 | 22.64 | 22.64 | 22.64 |
| Inventories | 28.6 | 89.3 | 242.6 | 282.3 | 416.1 | 647.8 | 916.9 | 1,297.7 | 1,836.8 | 2,599.8 |
| Inventories, % | 6.67 | 28.91 | 20.63 | 19.94 | 16.92 | 18.61 | 18.61 | 18.61 | 18.61 | 18.61 |
| Accounts Payable | 122.5 | 232.0 | 168.0 | 294.8 | 315.1 | 1,055.3 | 1,493.7 | 2,114.2 | 2,992.4 | 4,235.4 |
| Accounts Payable, % | 28.6 | 75.1 | 14.29 | 20.82 | 12.82 | 30.32 | 30.32 | 30.32 | 30.32 | 30.32 |
| Capital Expenditure | -158.6 | -229.0 | -314.9 | -469.1 | -581.3 | -1,355.4 | -1,918.4 | -2,715.2 | -3,843.1 | -5,439.5 |
| Capital Expenditure, % | -37.04 | -74.15 | -26.77 | -33.13 | -23.64 | -38.95 | -38.95 | -38.95 | -38.95 | -38.95 |
| Tax Rate, % | -6.77 | -6.77 | -6.77 | -6.77 | -6.77 | -6.77 | -6.77 | -6.77 | -6.77 | -6.77 |
| EBITAT | -967.0 | -1,639.6 | -1,414.4 | -1,832.8 | -1,294.3 | -3,109.5 | -4,401.1 | -6,229.3 | -8,816.9 | -12,479.3 |
| Depreciation | ||||||||||
| Changes in Account Receivables | ||||||||||
| Changes in Inventories | ||||||||||
| Changes in Accounts Payable | ||||||||||
| Capital Expenditure | ||||||||||
| UFCF | -1,083.9 | -1,796.9 | -2,320.6 | -1,821.6 | -2,124.1 | -4,161.5 | -6,213.1 | -8,794.0 | -12,446.9 | -17,617.2 |
| WACC, % | 7.28 | 7.28 | 7.28 | 7.28 | 7.28 | 7.28 | 7.28 | 7.28 | 7.28 | 7.28 |
| PV UFCF | ||||||||||
| SUM PV UFCF | -38,190.2 | |||||||||
| Long Term Growth Rate, % | 2.00 | |||||||||
| Free cash flow (T + 1) | -17,970 | |||||||||
| Terminal Value | -340,104 | |||||||||
| Present Terminal Value | -239,302 | |||||||||
| Enterprise Value | -277,492 | |||||||||
| Net Debt | -2,242 | |||||||||
| Equity Value | -275,250 | |||||||||
| Diluted Shares Outstanding, MM | 104 | |||||||||
| Equity Value Per Share | -2,636.82 |
What You Will Receive
- Comprehensive Financial Model: BeiGene’s actual data facilitates accurate DCF valuation.
- Complete Forecast Control: Modify revenue growth, profit margins, WACC, and other essential factors.
- Real-Time Calculations: Instant updates provide immediate insights as adjustments are made.
- Professional-Grade Template: A polished Excel file crafted for high-quality valuation needs.
- Flexible and Reusable: Designed for adaptability, enabling multiple uses for in-depth forecasts.
Key Features
- Comprehensive DCF Calculator: Offers detailed unlevered and levered DCF valuation models tailored for BeiGene, Ltd. (BGNE).
- WACC Calculator: Features a pre-built Weighted Average Cost of Capital sheet with adjustable inputs for accurate assessments.
- Customizable Forecast Assumptions: Easily alter growth rates, capital expenditures, and discount rates to fit your analysis.
- Integrated Financial Ratios: Evaluate profitability, leverage, and efficiency ratios specifically for BeiGene, Ltd. (BGNE).
- Interactive Dashboard and Charts: Visual representations summarize essential valuation metrics for streamlined analysis.
How It Works
- Download: Obtain the pre-built Excel file featuring BeiGene, Ltd.'s (BGNE) financial data.
- Customize: Modify projections, including revenue growth, EBITDA %, and WACC.
- Update Automatically: The intrinsic value and NPV calculations refresh in real-time.
- Test Scenarios: Develop various forecasts and compare results instantly.
- Make Decisions: Leverage the valuation outcomes to inform your investment strategy.
Why Choose BeiGene, Ltd. (BGNE)?
- Innovative Solutions: Access cutting-edge therapies designed to transform patient care.
- Commitment to Quality: Rigorous research and development ensure high standards in every product.
- Global Reach: Benefit from a worldwide network that enhances collaboration and distribution.
- Patient-Centric Approach: Focused on addressing unmet medical needs and improving outcomes.
- Expertise You Can Trust: Backed by a team of seasoned professionals dedicated to excellence.
Who Should Use This Product?
- Biotech Students: Understand drug development processes and apply them using real-world case studies.
- Researchers: Integrate cutting-edge models into academic projects or scientific studies.
- Investors: Evaluate your investment strategies and assess valuation metrics for BeiGene, Ltd. (BGNE).
- Market Analysts: Enhance your analysis capabilities with a customizable financial model tailored for biotech firms.
- Healthcare Entrepreneurs: Learn how large biotech companies like BeiGene, Ltd. (BGNE) are assessed and valued in the market.
What the Template Contains
- Operating and Balance Sheet Data: Pre-filled BeiGene historical data and forecasts, including revenue, EBITDA, EBIT, and capital expenditures.
- WACC Calculation: A dedicated sheet for Weighted Average Cost of Capital (WACC), including parameters like Beta, risk-free rate, and share price.
- DCF Valuation (Unlevered and Levered): Editable Discounted Cash Flow models showing intrinsic value with detailed calculations.
- Financial Statements: Pre-loaded financial statements (annual and quarterly) to support analysis.
- Key Ratios: Includes profitability, leverage, and efficiency ratios for BeiGene, Ltd. (BGNE).
- Dashboard and Charts: Visual summary of valuation outputs and assumptions to analyze results easily.
Disclaimer
All information, articles, and product details provided on this website are for general informational and educational purposes only. We do not claim any ownership over, nor do we intend to infringe upon, any trademarks, copyrights, logos, brand names, or other intellectual property mentioned or depicted on this site. Such intellectual property remains the property of its respective owners, and any references here are made solely for identification or informational purposes, without implying any affiliation, endorsement, or partnership.
We make no representations or warranties, express or implied, regarding the accuracy, completeness, or suitability of any content or products presented. Nothing on this website should be construed as legal, tax, investment, financial, medical, or other professional advice. In addition, no part of this site—including articles or product references—constitutes a solicitation, recommendation, endorsement, advertisement, or offer to buy or sell any securities, franchises, or other financial instruments, particularly in jurisdictions where such activity would be unlawful.
All content is of a general nature and may not address the specific circumstances of any individual or entity. It is not a substitute for professional advice or services. Any actions you take based on the information provided here are strictly at your own risk. You accept full responsibility for any decisions or outcomes arising from your use of this website and agree to release us from any liability in connection with your use of, or reliance upon, the content or products found herein.