
|
Bank der Irland Group Plc (BIRG.IR) DCF -Bewertung |
Fully Editable: Tailor To Your Needs In Excel Or Sheets
Professional Design: Trusted, Industry-Standard Templates
Investor-Approved Valuation Models
MAC/PC Compatible, Fully Unlocked
No Expertise Is Needed; Easy To Follow
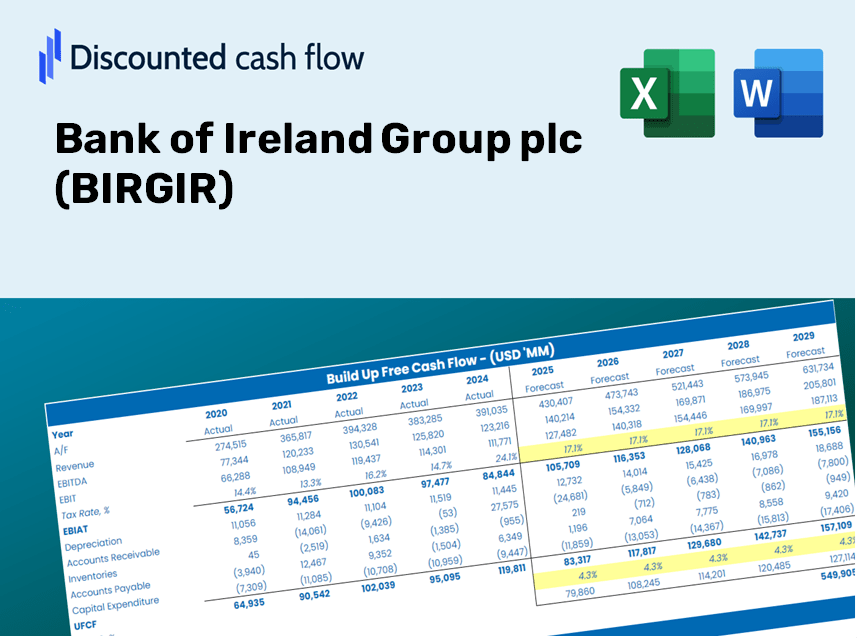
Bank of Ireland Group plc (BIRG.IR) Bundle
Streamline Bank of Ireland Group PLC (BIRGIR) Bewertung mit diesem anpassbaren DCF -Taschenrechner! Ausgestattet mit der tatsächlichen Bank of Bank of Ireland Group PLC (BIRGIR) und einstellbaren Prognoseparametern können Sie Szenarien untersuchen und in nur wenigen Minuten die Fair -Wert der Bank of Ireland Group (BIRGIR) ermitteln.
Discounted Cash Flow (DCF) - (USD MM)
| Year | AY1 2020 |
AY2 2021 |
AY3 2022 |
AY4 2023 |
AY5 2024 |
FY1 2025 |
FY2 2026 |
FY3 2027 |
FY4 2028 |
FY5 2029 |
|---|---|---|---|---|---|---|---|---|---|---|
| Revenue | 1,525.0 | 3,185.0 | 2,957.0 | 4,089.0 | 4,317.0 | 5,792.3 | 7,771.8 | 10,427.9 | 13,991.6 | 18,773.2 |
| Revenue Growth, % | 0 | 108.85 | -7.16 | 38.28 | 5.58 | 34.17 | 34.17 | 34.17 | 34.17 | 34.17 |
| EBITDA | -374.0 | 1,468.0 | 1,248.0 | 2,211.0 | 2,166.0 | 1,946.4 | 2,611.6 | 3,504.1 | 4,701.6 | 6,308.4 |
| EBITDA, % | -24.52 | 46.09 | 42.2 | 54.07 | 50.17 | 33.6 | 33.6 | 33.6 | 33.6 | 33.6 |
| Depreciation | .0 | 247.0 | 237.0 | 273.0 | 311.0 | 343.5 | 460.9 | 618.4 | 829.7 | 1,113.3 |
| Depreciation, % | 0 | 7.76 | 8.01 | 6.68 | 7.2 | 5.93 | 5.93 | 5.93 | 5.93 | 5.93 |
| EBIT | -374.0 | 1,221.0 | 1,011.0 | 1,938.0 | 1,855.0 | 1,602.9 | 2,150.7 | 2,885.7 | 3,871.9 | 5,195.2 |
| EBIT, % | -24.52 | 38.34 | 34.19 | 47.4 | 42.97 | 27.67 | 27.67 | 27.67 | 27.67 | 27.67 |
| Total Cash | 12,429.0 | 32,818.0 | 38,105.0 | 33,025.0 | 33,781.0 | 5,792.3 | 7,771.8 | 10,427.9 | 13,991.6 | 18,773.2 |
| Total Cash, percent | .0 | .0 | .0 | .0 | .0 | .0 | .0 | .0 | .0 | .0 |
| Account Receivables | 852.0 | 910.0 | 769.0 | 1,127.0 | 1,127.0 | 1,901.2 | 2,550.9 | 3,422.7 | 4,592.4 | 6,161.9 |
| Account Receivables, % | 55.87 | 28.57 | 26.01 | 27.56 | 26.11 | 32.82 | 32.82 | 32.82 | 32.82 | 32.82 |
| Inventories | .0 | .0 | .0 | .0 | .0 | .0 | .0 | .0 | .0 | .0 |
| Inventories, % | 0 | 0 | 0 | 0 | 0 | 0 | 0 | 0 | 0 | 0 |
| Accounts Payable | 125.0 | 107.0 | 139.0 | 324.0 | 427.0 | 394.7 | 529.6 | 710.6 | 953.4 | 1,279.3 |
| Accounts Payable, % | 8.2 | 3.36 | 4.7 | 7.92 | 9.89 | 6.81 | 6.81 | 6.81 | 6.81 | 6.81 |
| Capital Expenditure | -283.0 | -320.0 | -368.0 | -413.0 | -520.0 | -732.1 | -982.3 | -1,318.0 | -1,768.4 | -2,372.7 |
| Capital Expenditure, % | -18.56 | -10.05 | -12.45 | -10.1 | -12.05 | -12.64 | -12.64 | -12.64 | -12.64 | -12.64 |
| Tax Rate, % | 17.47 | 17.47 | 17.47 | 17.47 | 17.47 | 17.47 | 17.47 | 17.47 | 17.47 | 17.47 |
| EBITAT | -365.1 | 1,048.0 | 850.0 | 1,595.0 | 1,531.0 | 1,386.1 | 1,859.8 | 2,495.4 | 3,348.2 | 4,492.5 |
| Depreciation | ||||||||||
| Changes in Account Receivables | ||||||||||
| Changes in Inventories | ||||||||||
| Changes in Accounts Payable | ||||||||||
| Capital Expenditure | ||||||||||
| UFCF | -1,375.1 | 899.0 | 892.0 | 1,282.0 | 1,425.0 | 191.0 | 823.6 | 1,105.0 | 1,482.7 | 1,989.4 |
| WACC, % | 14.58 | 13.28 | 13.08 | 12.88 | 12.91 | 13.35 | 13.35 | 13.35 | 13.35 | 13.35 |
| PV UFCF | ||||||||||
| SUM PV UFCF | 3,530.1 | |||||||||
| Long Term Growth Rate, % | 2.00 | |||||||||
| Free cash flow (T + 1) | 2,029 | |||||||||
| Terminal Value | 17,884 | |||||||||
| Present Terminal Value | 9,559 | |||||||||
| Enterprise Value | 13,089 | |||||||||
| Net Debt | -21,079 | |||||||||
| Equity Value | 34,168 | |||||||||
| Diluted Shares Outstanding, MM | 1,024 | |||||||||
| Equity Value Per Share | 33.37 |
What You Will Receive
- Genuine Bank of Ireland Data: Preloaded financial metrics – covering everything from revenue to EBIT – based on actual and projected data.
- Comprehensive Customization: Modify all essential parameters (yellow cells) such as WACC, growth %, and tax rates.
- Real-Time Valuation Updates: Automatic recalculations to assess the effects of changes on the fair value of Bank of Ireland Group plc (BIRGIR).
- Flexible Excel Template: Designed for easy modifications, scenario simulations, and in-depth projections.
- Efficient and Precise: Eliminate the need to build models from scratch while ensuring accuracy and adaptability.
Key Features
- Real-Time BIRGIR Data: Pre-filled with the Bank of Ireland Group's historical financial performance and future projections.
- Completely Customizable Inputs: Adjust parameters such as interest rates, loan growth, operational margins, tax rates, and capital expenditures.
- Dynamic Valuation Model: Automatically updates the Net Present Value (NPV) and intrinsic value in response to your adjustments.
- Scenario Analysis: Develop various forecasting scenarios to evaluate different valuation results.
- User-Centric Interface: Intuitive, organized, and suitable for both industry professionals and newcomers.
How It Works
- Step 1: Download the Excel file.
- Step 2: Review the pre-populated data for Bank of Ireland Group plc (BIRGIR) including historical and projected figures.
- Step 3: Modify the key assumptions (highlighted in yellow) according to your analysis.
- Step 4: Observe the automatic recalculations that determine the intrinsic value of Bank of Ireland Group plc (BIRGIR).
- Step 5: Utilize the results for your investment decisions or reporting purposes.
Why Opt for the Bank of Ireland Group plc Calculator?
- Save Time: Eliminate the hassle of building a DCF model from the ground up – it’s ready for immediate use.
- Enhance Accuracy: Dependable financial data and formulas minimize valuation errors.
- Completely Customizable: Adjust the model to align with your specific assumptions and forecasts.
- User-Friendly: Intuitive charts and outputs simplify result analysis.
- Endorsed by Professionals: Crafted for industry experts who prioritize precision and ease of use.
Who Can Benefit from Bank of Ireland Group's Services?
- Investors: Make informed investment choices with a trustworthy financial tool from Bank of Ireland Group (BIRGIR).
- Financial Analysts: Streamline your workflow with customizable financial models provided by Bank of Ireland Group (BIRGIR).
- Consultants: Effortlessly tailor presentations and reports for your clients using Bank of Ireland Group's (BIRGIR) resources.
- Finance Enthusiasts: Enhance your knowledge of financial principles through practical examples and insights offered by Bank of Ireland Group (BIRGIR).
- Educators and Students: Leverage Bank of Ireland Group's (BIRGIR) materials as a valuable resource in finance-related academic programs.
What the Template Includes
- Comprehensive DCF Model: Editable template featuring detailed valuation computations.
- Real-World Data: Bank of Ireland Group's (BIRGIR) historical and projected financials preloaded for thorough analysis.
- Customizable Parameters: Modify WACC, growth rates, and tax assumptions to explore various scenarios.
- Financial Statements: Complete annual and quarterly breakdowns providing deeper insights.
- Key Ratios: Integrated analysis for profitability, efficiency, and leverage metrics.
- Dashboard with Visual Outputs: Graphs and tables presenting clear, actionable outcomes.
Disclaimer
All information, articles, and product details provided on this website are for general informational and educational purposes only. We do not claim any ownership over, nor do we intend to infringe upon, any trademarks, copyrights, logos, brand names, or other intellectual property mentioned or depicted on this site. Such intellectual property remains the property of its respective owners, and any references here are made solely for identification or informational purposes, without implying any affiliation, endorsement, or partnership.
We make no representations or warranties, express or implied, regarding the accuracy, completeness, or suitability of any content or products presented. Nothing on this website should be construed as legal, tax, investment, financial, medical, or other professional advice. In addition, no part of this site—including articles or product references—constitutes a solicitation, recommendation, endorsement, advertisement, or offer to buy or sell any securities, franchises, or other financial instruments, particularly in jurisdictions where such activity would be unlawful.
All content is of a general nature and may not address the specific circumstances of any individual or entity. It is not a substitute for professional advice or services. Any actions you take based on the information provided here are strictly at your own risk. You accept full responsibility for any decisions or outcomes arising from your use of this website and agree to release us from any liability in connection with your use of, or reliance upon, the content or products found herein.