
|
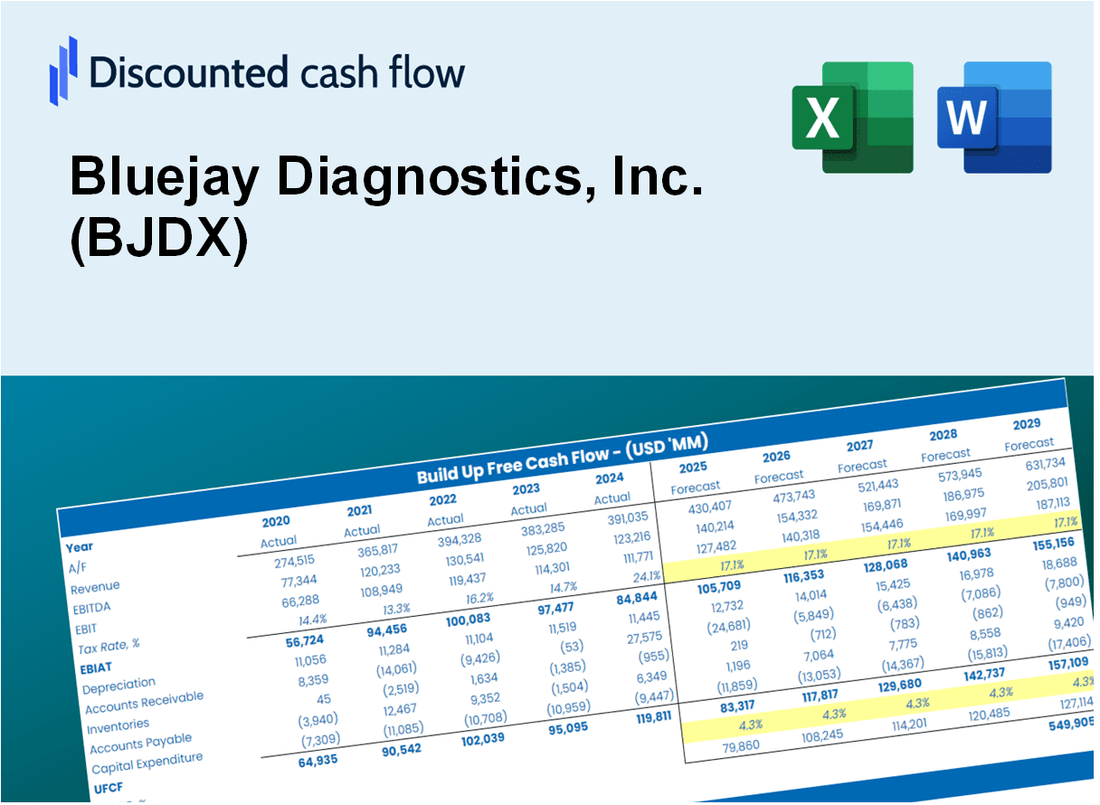
Bluejay Diagnostics, Inc. (BJDX) DCF -Bewertung |
Fully Editable: Tailor To Your Needs In Excel Or Sheets
Professional Design: Trusted, Industry-Standard Templates
Investor-Approved Valuation Models
MAC/PC Compatible, Fully Unlocked
No Expertise Is Needed; Easy To Follow
Bluejay Diagnostics, Inc. (BJDX) Bundle
Unabhängig davon, ob Sie ein Investor oder Analyst sind, ist dieser (BJDX) DCF-Taschenrechner Ihr Go-to-Tool für eine genaue Bewertung. Mit echten Daten von Bluejay Diagnostics, Inc., können Sie Prognosen anpassen und die Auswirkungen in Echtzeit beobachten.
Discounted Cash Flow (DCF) - (USD MM)
| Year | AY1 2020 |
AY2 2021 |
AY3 2022 |
AY4 2023 |
AY5 2024 |
FY1 2025 |
FY2 2026 |
FY3 2027 |
FY4 2028 |
FY5 2029 |
|---|---|---|---|---|---|---|---|---|---|---|
| Revenue | .0 | .0 | .2 | .0 | .0 | .0 | .0 | .0 | .0 | .0 |
| Revenue Growth, % | 0 | 0 | 0 | -100 | 0 | -25 | -25 | -25 | -25 | -25 |
| EBITDA | -1.0 | -3.1 | -9.0 | -9.2 | -6.7 | .0 | .0 | .0 | .0 | .0 |
| EBITDA, % | 100 | 100 | -3618.46 | 100 | 100 | 60 | 60 | 60 | 60 | 60 |
| Depreciation | .2 | .1 | .3 | .8 | .2 | .0 | .0 | .0 | .0 | .0 |
| Depreciation, % | 100 | 100 | 123.02 | 100 | 100 | 100 | 100 | 100 | 100 | 100 |
| EBIT | -1.2 | -3.2 | -9.3 | -10.0 | -6.9 | .0 | .0 | .0 | .0 | .0 |
| EBIT, % | 100 | 100 | -3741.48 | 100 | 100 | 60 | 60 | 60 | 60 | 60 |
| Total Cash | .9 | 19.0 | 10.1 | 2.2 | 4.3 | .0 | .0 | .0 | .0 | .0 |
| Total Cash, percent | .0 | .0 | .0 | .0 | .0 | .0 | .0 | .0 | .0 | .0 |
| Account Receivables | .0 | .0 | .0 | .0 | .0 | .0 | .0 | .0 | .0 | .0 |
| Account Receivables, % | 100 | 100 | 0 | 100 | 100 | 80 | 80 | 80 | 80 | 80 |
| Inventories | .1 | .0 | .0 | .0 | .0 | .0 | .0 | .0 | .0 | .0 |
| Inventories, % | 100 | 100 | 0 | 100 | 100 | 80 | 80 | 80 | 80 | 80 |
| Accounts Payable | .4 | .3 | .6 | .5 | .1 | .0 | .0 | .0 | .0 | .0 |
| Accounts Payable, % | 100 | 100 | 255.31 | 100 | 100 | 100 | 100 | 100 | 100 | 100 |
| Capital Expenditure | .0 | .0 | -1.2 | -.7 | -.3 | .0 | .0 | .0 | .0 | .0 |
| Capital Expenditure, % | 100 | 100 | -481.56 | 100 | 100 | -20 | -20 | -20 | -20 | -20 |
| Tax Rate, % | 0 | 0 | 0 | 0 | 0 | 0 | 0 | 0 | 0 | 0 |
| EBITAT | -1.2 | -3.5 | -9.3 | -10.0 | -6.9 | .0 | .0 | .0 | .0 | .0 |
| Depreciation | ||||||||||
| Changes in Account Receivables | ||||||||||
| Changes in Inventories | ||||||||||
| Changes in Accounts Payable | ||||||||||
| Capital Expenditure | ||||||||||
| UFCF | -.7 | -3.3 | -9.9 | -10.1 | -7.3 | -.1 | .0 | .0 | .0 | .0 |
| WACC, % | 165.63 | 170.32 | 170.32 | 170.32 | 170.32 | 169.38 | 169.38 | 169.38 | 169.38 | 169.38 |
| PV UFCF | ||||||||||
| SUM PV UFCF | .0 | |||||||||
| Long Term Growth Rate, % | 2.00 | |||||||||
| Free cash flow (T + 1) | 0 | |||||||||
| Terminal Value | 0 | |||||||||
| Present Terminal Value | 0 | |||||||||
| Enterprise Value | 0 | |||||||||
| Net Debt | -4 | |||||||||
| Equity Value | 4 | |||||||||
| Diluted Shares Outstanding, MM | 0 | |||||||||
| Equity Value Per Share | 21.98 |
What You Will Get
- Real BJDX Financials: Access detailed historical and projected data for precise valuation.
- Customizable Inputs: Adjust parameters such as WACC, tax rates, revenue growth, and capital expenditures.
- Dynamic Calculations: Intrinsic value and NPV are computed in real-time.
- Scenario Analysis: Explore various scenarios to assess Bluejay Diagnostics' future performance.
- User-Friendly Design: Designed for industry experts while remaining approachable for newcomers.
Key Features
- Pre-Loaded Data: Bluejay Diagnostics, Inc.'s (BJDX) historical financial statements and pre-filled forecasts.
- Fully Adjustable Inputs: Modify WACC, tax rates, revenue growth, and EBITDA margins as needed.
- Instant Results: Observe BJDX's intrinsic value recalculating in real time.
- Clear Visual Outputs: Dashboard charts illustrate valuation results and key metrics effectively.
- Built for Accuracy: A professional tool designed for analysts, investors, and finance experts.
How It Works
- Download: Obtain the pre-formatted Excel file containing Bluejay Diagnostics, Inc.'s (BJDX) financial data.
- Customize: Modify forecasts, such as revenue growth, EBITDA %, and WACC.
- Update Automatically: The intrinsic value and NPV calculations refresh in real-time.
- Test Scenarios: Develop various projections and instantly compare results.
- Make Decisions: Leverage the valuation findings to inform your investment strategy.
Why Choose Bluejay Diagnostics, Inc. (BJDX)?
- Innovative Solutions: Cutting-edge diagnostic technologies that enhance patient care.
- Proven Reliability: Backed by rigorous research and validated results for accurate diagnostics.
- Customizable Options: Flexible diagnostic tools tailored to meet diverse healthcare needs.
- User-Friendly Interface: Intuitive design ensures easy navigation and efficient use.
- Endorsed by Professionals: Trusted by healthcare experts for its precision and effectiveness.
Who Should Use This Product?
- Healthcare Professionals: Utilize advanced diagnostic tools to enhance patient care.
- Researchers: Integrate innovative diagnostic methodologies into studies and publications.
- Investors: Evaluate your investment strategies and assess the market potential of Bluejay Diagnostics, Inc. (BJDX).
- Analysts: Optimize your analysis process with a tailored, user-friendly diagnostic model.
- Medical Institutions: Understand how emerging companies like Bluejay Diagnostics, Inc. (BJDX) are transforming the healthcare landscape.
What the Template Contains
- Historical Data: Includes Bluejay Diagnostics, Inc.'s (BJDX) past financials and baseline forecasts.
- DCF and Levered DCF Models: Detailed templates to calculate Bluejay Diagnostics, Inc.'s (BJDX) intrinsic value.
- WACC Sheet: Pre-built calculations for Weighted Average Cost of Capital.
- Editable Inputs: Modify key drivers like growth rates, EBITDA %, and CAPEX assumptions.
- Quarterly and Annual Statements: A complete breakdown of Bluejay Diagnostics, Inc.'s (BJDX) financials.
- Interactive Dashboard: Visualize valuation results and projections dynamically.
Disclaimer
All information, articles, and product details provided on this website are for general informational and educational purposes only. We do not claim any ownership over, nor do we intend to infringe upon, any trademarks, copyrights, logos, brand names, or other intellectual property mentioned or depicted on this site. Such intellectual property remains the property of its respective owners, and any references here are made solely for identification or informational purposes, without implying any affiliation, endorsement, or partnership.
We make no representations or warranties, express or implied, regarding the accuracy, completeness, or suitability of any content or products presented. Nothing on this website should be construed as legal, tax, investment, financial, medical, or other professional advice. In addition, no part of this site—including articles or product references—constitutes a solicitation, recommendation, endorsement, advertisement, or offer to buy or sell any securities, franchises, or other financial instruments, particularly in jurisdictions where such activity would be unlawful.
All content is of a general nature and may not address the specific circumstances of any individual or entity. It is not a substitute for professional advice or services. Any actions you take based on the information provided here are strictly at your own risk. You accept full responsibility for any decisions or outcomes arising from your use of this website and agree to release us from any liability in connection with your use of, or reliance upon, the content or products found herein.