
|
Die DCF -Bewertung der Berkeley Group Holdings Plc (BKG.L) |
Fully Editable: Tailor To Your Needs In Excel Or Sheets
Professional Design: Trusted, Industry-Standard Templates
Investor-Approved Valuation Models
MAC/PC Compatible, Fully Unlocked
No Expertise Is Needed; Easy To Follow
The Berkeley Group Holdings plc (BKG.L) Bundle
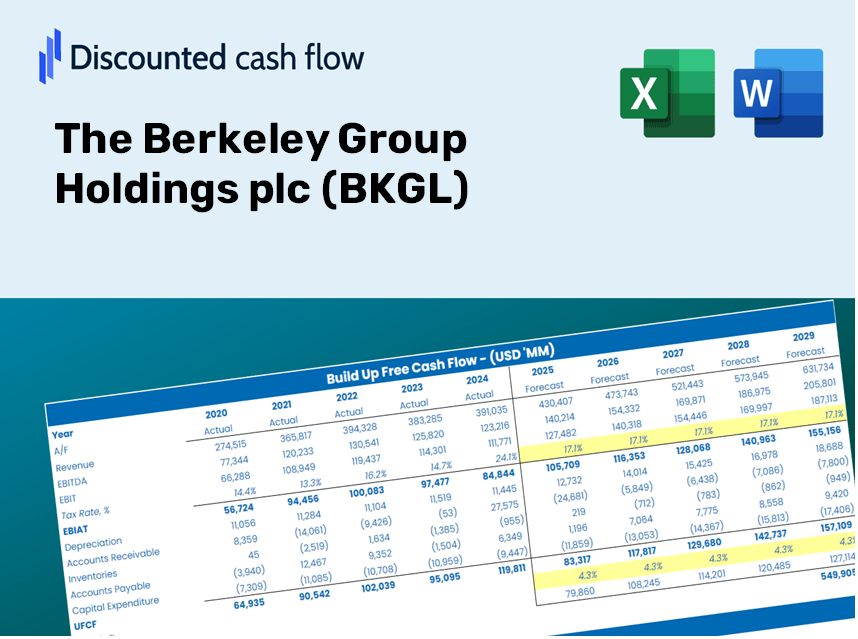
Vereinfachen Sie die Bewertung der Berkeley Group Holdings Plc (BKGL) mit diesem anpassbaren DCF -Taschenrechner! Mit Real The Berkeley Group Holdings Plc (BKGL) Financials und einstellbaren Prognoseeingaben können Sie die Szenarien testen und den Fair -Wert der Berkeley Group Holdings (BKGL) in Minuten aufdecken.
Discounted Cash Flow (DCF) - (USD MM)
| Year | AY1 2021 |
AY2 2022 |
AY3 2023 |
AY4 2024 |
AY5 2025 |
FY1 2026 |
FY2 2027 |
FY3 2028 |
FY4 2029 |
FY5 2030 |
|---|---|---|---|---|---|---|---|---|---|---|
| Revenue | 2,202.2 | 2,348.0 | 2,550.2 | 2,464.3 | 2,486.5 | 2,565.8 | 2,647.7 | 2,732.2 | 2,819.4 | 2,909.4 |
| Revenue Growth, % | 0 | 6.62 | 8.61 | -3.37 | 0.90086 | 3.19 | 3.19 | 3.19 | 3.19 | 3.19 |
| EBITDA | 531.7 | 569.2 | 547.0 | 591.3 | 561.7 | 597.4 | 616.5 | 636.2 | 656.5 | 677.4 |
| EBITDA, % | 24.14 | 24.24 | 21.45 | 23.99 | 22.59 | 23.28 | 23.28 | 23.28 | 23.28 | 23.28 |
| Depreciation | 5.9 | 5.6 | 5.6 | 4.8 | 3.8 | 5.5 | 5.7 | 5.9 | 6.1 | 6.2 |
| Depreciation, % | 0.26791 | 0.2385 | 0.21959 | 0.19478 | 0.15283 | 0.21472 | 0.21472 | 0.21472 | 0.21472 | 0.21472 |
| EBIT | 525.8 | 563.6 | 541.4 | 586.5 | 557.9 | 591.9 | 610.8 | 630.3 | 650.4 | 671.2 |
| EBIT, % | 23.88 | 24 | 21.23 | 23.8 | 22.44 | 23.07 | 23.07 | 23.07 | 23.07 | 23.07 |
| Total Cash | 1,428.2 | 928.9 | 1,070.4 | 1,192.0 | 1,015.2 | 1,209.0 | 1,247.5 | 1,287.4 | 1,328.4 | 1,370.8 |
| Total Cash, percent | .0 | .0 | .0 | .0 | .0 | .0 | .0 | .0 | .0 | .0 |
| Account Receivables | 83.3 | 150.2 | 92.3 | 119.8 | 88.8 | 114.1 | 117.7 | 121.5 | 125.4 | 129.4 |
| Account Receivables, % | 3.78 | 6.4 | 3.62 | 4.86 | 3.57 | 4.45 | 4.45 | 4.45 | 4.45 | 4.45 |
| Inventories | 3,652.5 | 5,134.0 | 5,302.1 | 5,283.9 | 5,052.2 | 2,565.8 | 2,647.7 | 2,732.2 | 2,819.4 | 2,909.4 |
| Inventories, % | 165.86 | 218.65 | 207.91 | 214.42 | 203.19 | 100 | 100 | 100 | 100 | 100 |
| Accounts Payable | 509.2 | 635.5 | 602.6 | 736.6 | 838.1 | 705.2 | 727.7 | 750.9 | 774.9 | 799.6 |
| Accounts Payable, % | 23.12 | 27.07 | 23.63 | 29.89 | 33.71 | 27.48 | 27.48 | 27.48 | 27.48 | 27.48 |
| Capital Expenditure | -2.4 | -1.3 | -2.0 | -1.4 | -1.0 | -1.7 | -1.8 | -1.9 | -1.9 | -2.0 |
| Capital Expenditure, % | -0.10898 | -0.05536627 | -0.07842522 | -0.05681126 | -0.04021717 | -0.06796037 | -0.06796037 | -0.06796037 | -0.06796037 | -0.06796037 |
| Tax Rate, % | 27.77 | 27.77 | 27.77 | 27.77 | 27.77 | 27.77 | 27.77 | 27.77 | 27.77 | 27.77 |
| EBITAT | 448.4 | 548.8 | 496.6 | 418.4 | 402.9 | 494.8 | 510.6 | 526.9 | 543.7 | 561.0 |
| Depreciation | ||||||||||
| Changes in Account Receivables | ||||||||||
| Changes in Inventories | ||||||||||
| Changes in Accounts Payable | ||||||||||
| Capital Expenditure | ||||||||||
| UFCF | -2,774.7 | -869.0 | 357.1 | 546.5 | 769.9 | 2,826.7 | 451.4 | 465.8 | 480.7 | 496.1 |
| WACC, % | 8.77 | 8.88 | 8.83 | 8.65 | 8.66 | 8.76 | 8.76 | 8.76 | 8.76 | 8.76 |
| PV UFCF | ||||||||||
| SUM PV UFCF | 4,012.4 | |||||||||
| Long Term Growth Rate, % | 2.00 | |||||||||
| Free cash flow (T + 1) | 506 | |||||||||
| Terminal Value | 7,486 | |||||||||
| Present Terminal Value | 4,920 | |||||||||
| Enterprise Value | 8,932 | |||||||||
| Net Debt | -333 | |||||||||
| Equity Value | 9,265 | |||||||||
| Diluted Shares Outstanding, MM | 105 | |||||||||
| Equity Value Per Share | 8,798.63 |
What You Will Receive
- Accurate BKGL Financial Data: Preloaded with The Berkeley Group Holdings plc's historical and forecasted data for thorough analysis.
- Customizable Template: Easily adjust essential inputs such as revenue growth, WACC, and EBITDA percentage.
- Instant Calculations: Watch the intrinsic value of BKGL update in real-time as you modify inputs.
- Professional Valuation Tool: Tailored for investors, analysts, and consultants seeking reliable DCF results.
- Intuitive Design: User-friendly layout and straightforward instructions cater to all skill levels.
Key Features
- Comprehensive BKGL Financials: Gain access to reliable pre-loaded historical data and future forecasts specifically for The Berkeley Group Holdings plc (BKGL).
- Adjustable Forecast Parameters: Modify highlighted cells to tailor assumptions such as WACC, growth rates, and profit margins.
- Real-Time Calculations: Automatically recalibrate DCF, Net Present Value (NPV), and cash flow analyses as inputs change.
- Interactive Dashboard: Intuitive charts and summaries for clear visualization of your valuation outcomes.
- Designed for All Skill Levels: An easy-to-navigate structure created for investors, CFOs, and consultants alike.
How It Works
- Download: Obtain the pre-prepared Excel file containing The Berkeley Group Holdings plc’s (BKGL) financial data.
- Customize: Modify forecasts such as revenue growth, EBITDA percentage, and WACC to suit your needs.
- Update Automatically: Watch as intrinsic value and NPV calculations refresh in real-time.
- Test Scenarios: Develop multiple projections and instantly compare the results.
- Make Decisions: Leverage the valuation outcomes to inform your investment strategy.
Why Choose This Calculator for The Berkeley Group Holdings plc (BKGL)?
- Accurate Data: Utilize real financial metrics from The Berkeley Group for trustworthy valuation outcomes.
- Customizable: Tailor key variables such as growth rates, WACC, and tax rates to align with your forecasts.
- Time-Saving: Built-in calculations save you the hassle of starting from the ground up.
- Professional-Grade Tool: Specifically crafted for investors, analysts, and consultants in the real estate sector.
- User-Friendly: A straightforward design coupled with step-by-step guidance makes it accessible for everyone.
Who Can Benefit from This Product?
- Investors: Make informed choices with a top-tier valuation tool designed for precision.
- Financial Analysts: Streamline your workflow with a customizable DCF model ready to use.
- Consultants: Effortlessly modify the template for client decks or detailed reports.
- Finance Enthusiasts: Enhance your grasp of valuation methods through practical, real-world scenarios.
- Educators and Students: Utilize this as a hands-on resource for finance-related curricula.
What the Template Includes
- Comprehensive DCF Model: Fully editable template featuring in-depth valuation calculations.
- Real-World Data: The Berkeley Group Holdings plc’s (BKGL) historical and projected financials preloaded for insightful analysis.
- Customizable Parameters: Modify WACC, growth rates, and tax assumptions to explore various scenarios.
- Financial Statements: Complete annual and quarterly breakdowns for enhanced understanding.
- Key Ratios: Built-in analyses for profitability, efficiency, and leverage metrics.
- Dashboard with Visual Outputs: Charts and tables designed to deliver clear, actionable insights.
Disclaimer
All information, articles, and product details provided on this website are for general informational and educational purposes only. We do not claim any ownership over, nor do we intend to infringe upon, any trademarks, copyrights, logos, brand names, or other intellectual property mentioned or depicted on this site. Such intellectual property remains the property of its respective owners, and any references here are made solely for identification or informational purposes, without implying any affiliation, endorsement, or partnership.
We make no representations or warranties, express or implied, regarding the accuracy, completeness, or suitability of any content or products presented. Nothing on this website should be construed as legal, tax, investment, financial, medical, or other professional advice. In addition, no part of this site—including articles or product references—constitutes a solicitation, recommendation, endorsement, advertisement, or offer to buy or sell any securities, franchises, or other financial instruments, particularly in jurisdictions where such activity would be unlawful.
All content is of a general nature and may not address the specific circumstances of any individual or entity. It is not a substitute for professional advice or services. Any actions you take based on the information provided here are strictly at your own risk. You accept full responsibility for any decisions or outcomes arising from your use of this website and agree to release us from any liability in connection with your use of, or reliance upon, the content or products found herein.